
Since returning from vacation earlier this week, I have struggled to find any technical developments in the markets worth noting. US equities have been making a slow-grind higher over the last several months & despite the fact that some of the large cap indices are at or near new all-time highs, I continue to remain confident that the R/R at this point is clearly skewed to the downside. Another way to phrase that is that I believe the next 10-20% move in the market is more likely to be to the downside vs. the upside.
Unfortunately, other than the small caps & to a lesser extent, the mid caps, the large cap US stock indices such as the $SPX, $NDX, $COMPX, $DJIA, $NYSE, etc.., have yet to break down below their most recent uptrend lines along with most trend indicators still bullish at this time. However, based on the posture of the large cap indices, most are only a bad day or two away from doing so and as such, I am patiently watching closely for the next objective sell signal(s) in the broad markets.
Starting out with the big picture, here’s a 12 year weekly chart of the S&P 400 Mid Cap index. The vertical lines on this chart are cycle lines set 199 days apart, as that was the duration between the two previous bull market tops. As this chart shows, we are now just slightly past the 199-day mark since the previous bear market in the mid-caps kicked off back in 2011 (a bear market is typically defined as a drop of 20% or more). As with those two previous bull market tops, this most recent high in the $MID is also marked by a multi-month divergent high.
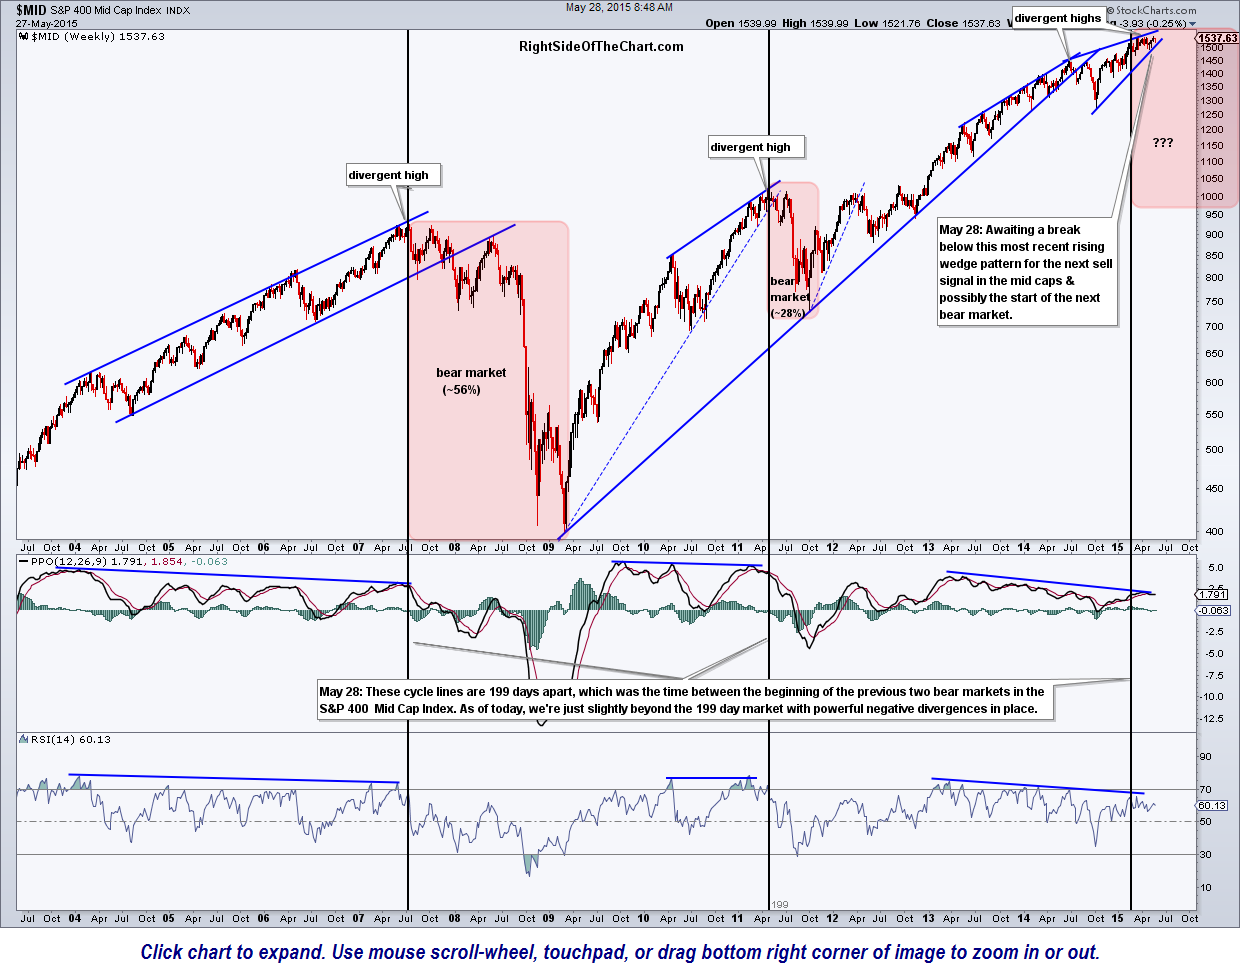
$MID 12 year weekly May 27th
This 6.3 year weekly chart of the Russell 2000 Small Cap Index shows a very similar pattern to the mid cap index above: A breakdown below the primary (bull market) uptrend line in late 2014, followed by prices going on to make a marginal new high within a bearish rising wedge pattern beneath the primary uptrend line, complete with a new set of multi-month negative divergences in place with both the RSI & MACD (as well as most other price & momentum indicators & oscillators).
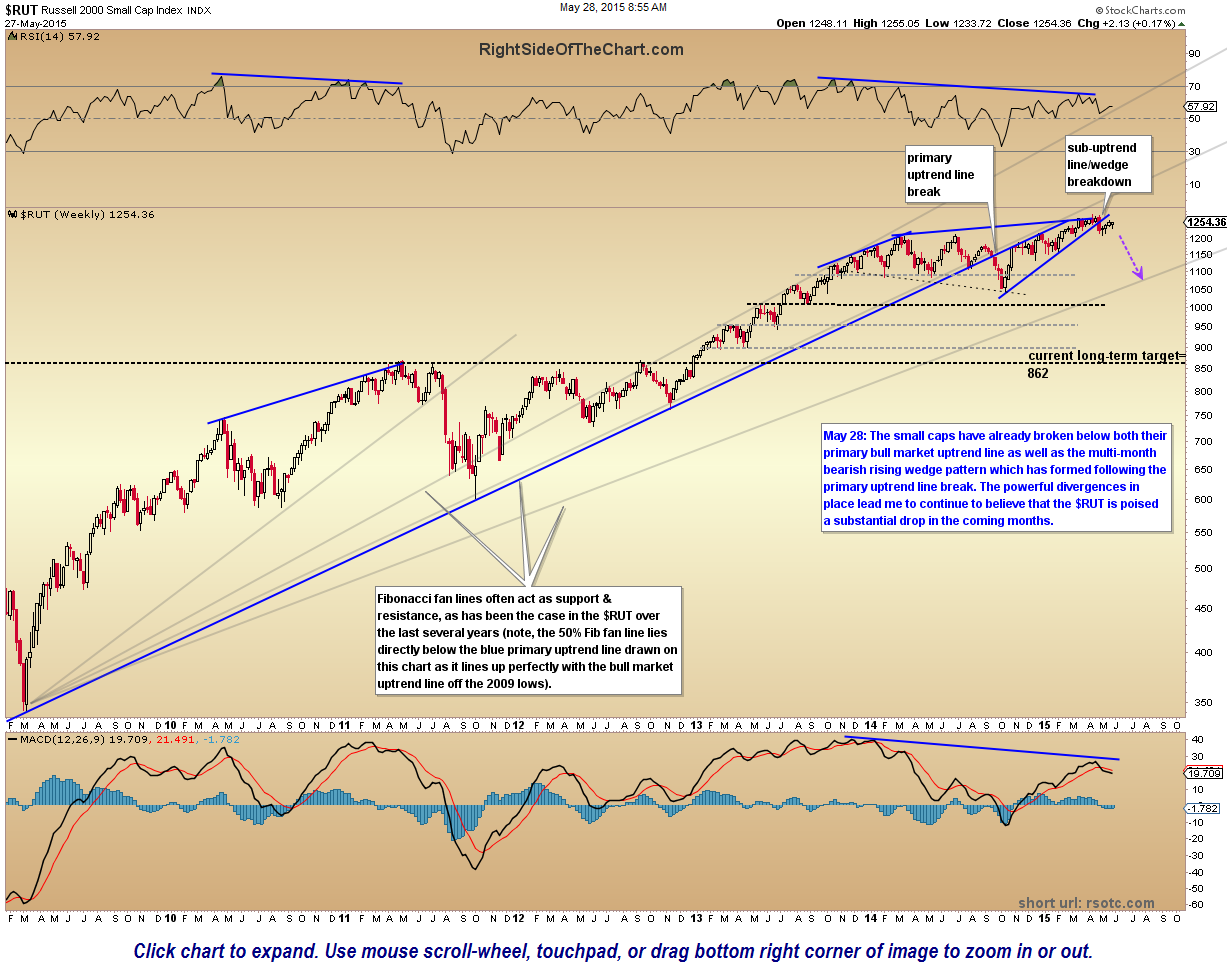
$RUT weekly May 28th
Moving on to the large cap indices, both the S&P 500 as well as the Nasdaq 100 continue to grind higher within multi-month bearish rising wedge pattern, also complete with solid negative divergences in place. The next major sell signal for the US markets will come once prices break below these rising wedge patterns and with the large caps riding precariously up the bottom of these patterns, those sell signals could come any day now. Unfortunately, this market has been plagued with whipsaw sell signals lately so the most prudent option at this point would be to wait for a clear break below these most recent uptrend lines on all the major indexes (not just one) and maybe even hold off until some of the intermediate-term trend indicators flip to bearish before adding or initiating any short exposure on the broad markets.
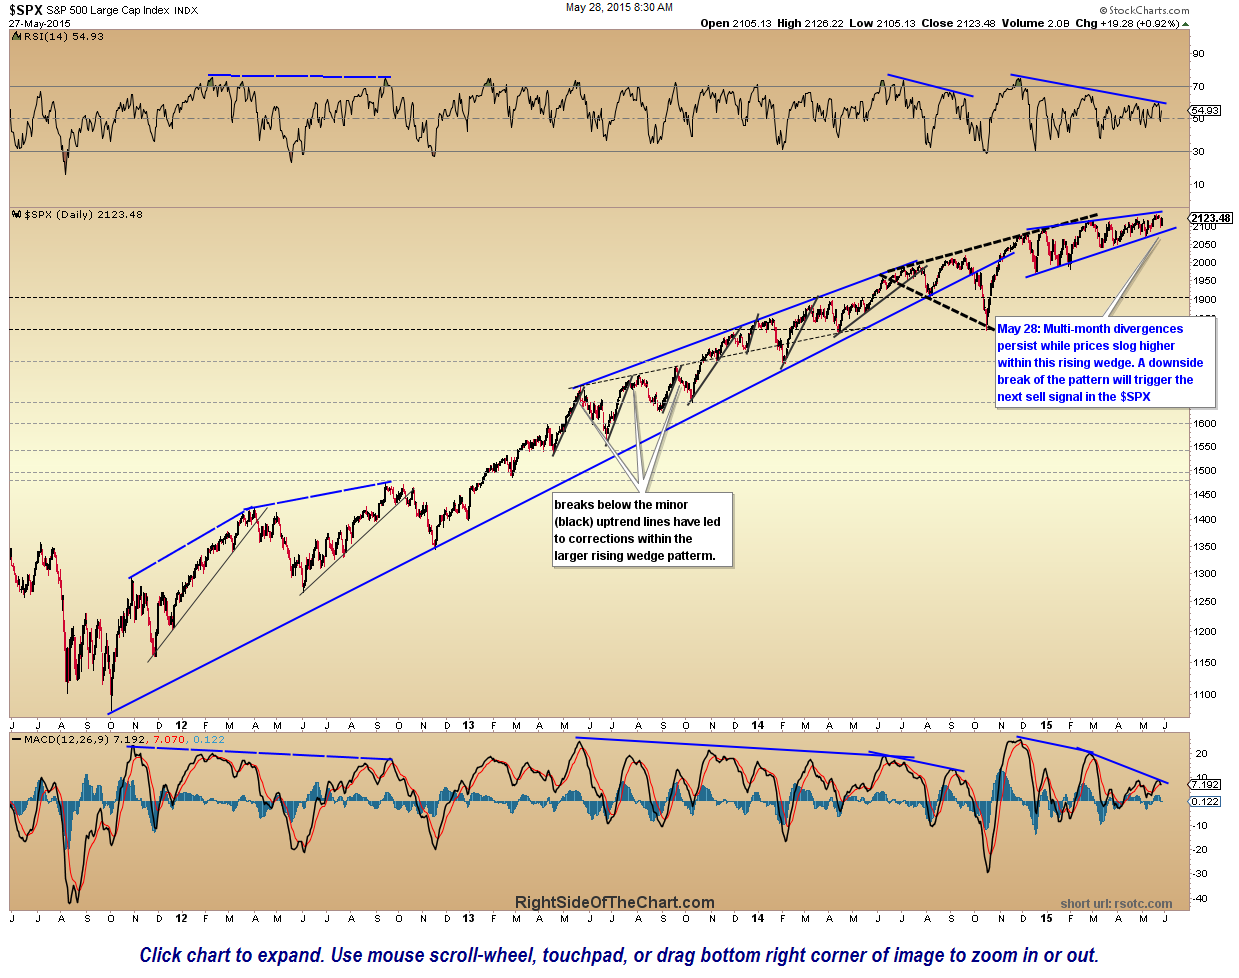
$SPX daily May 27th
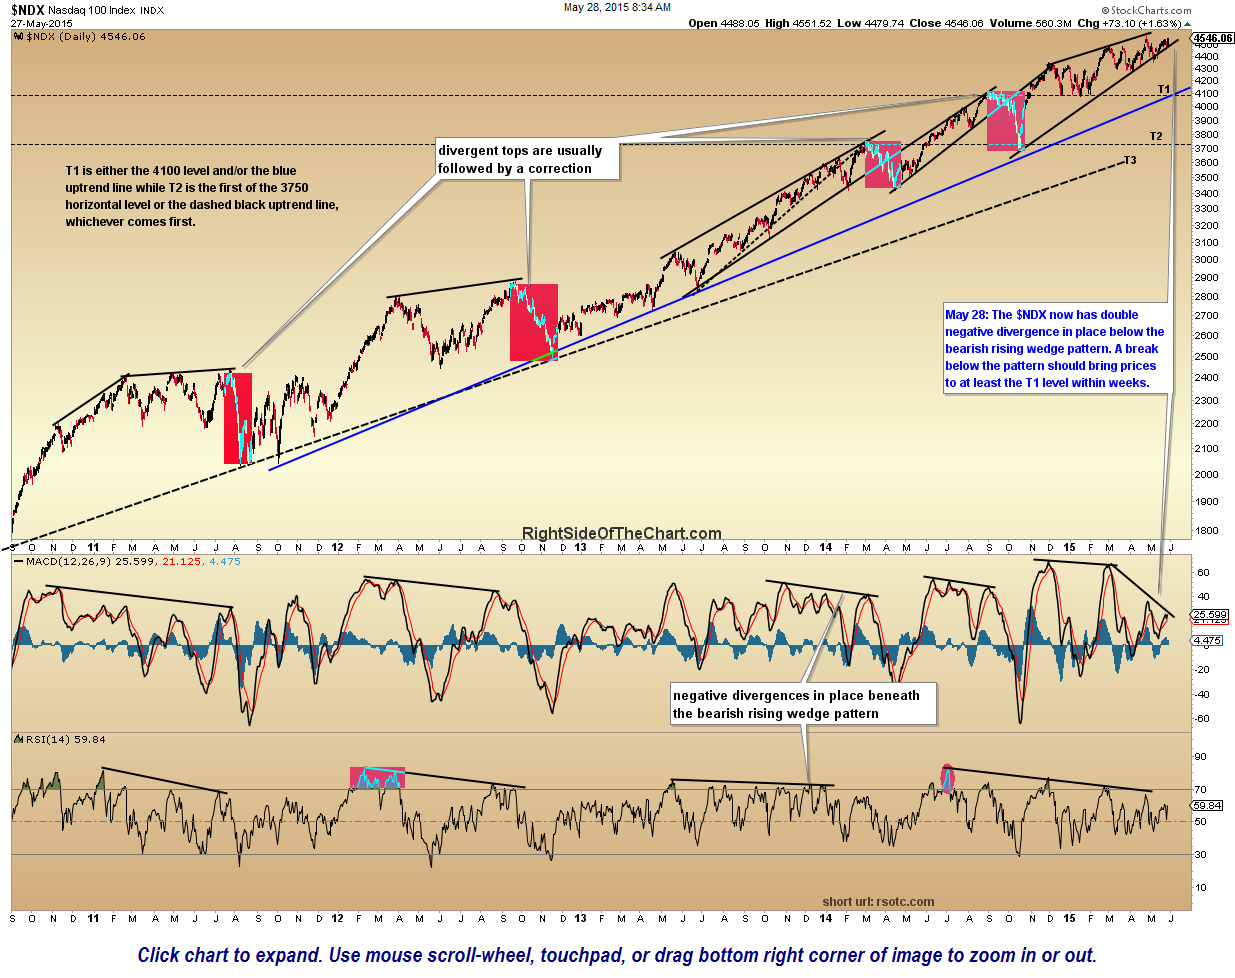
$NDX daily May 27th
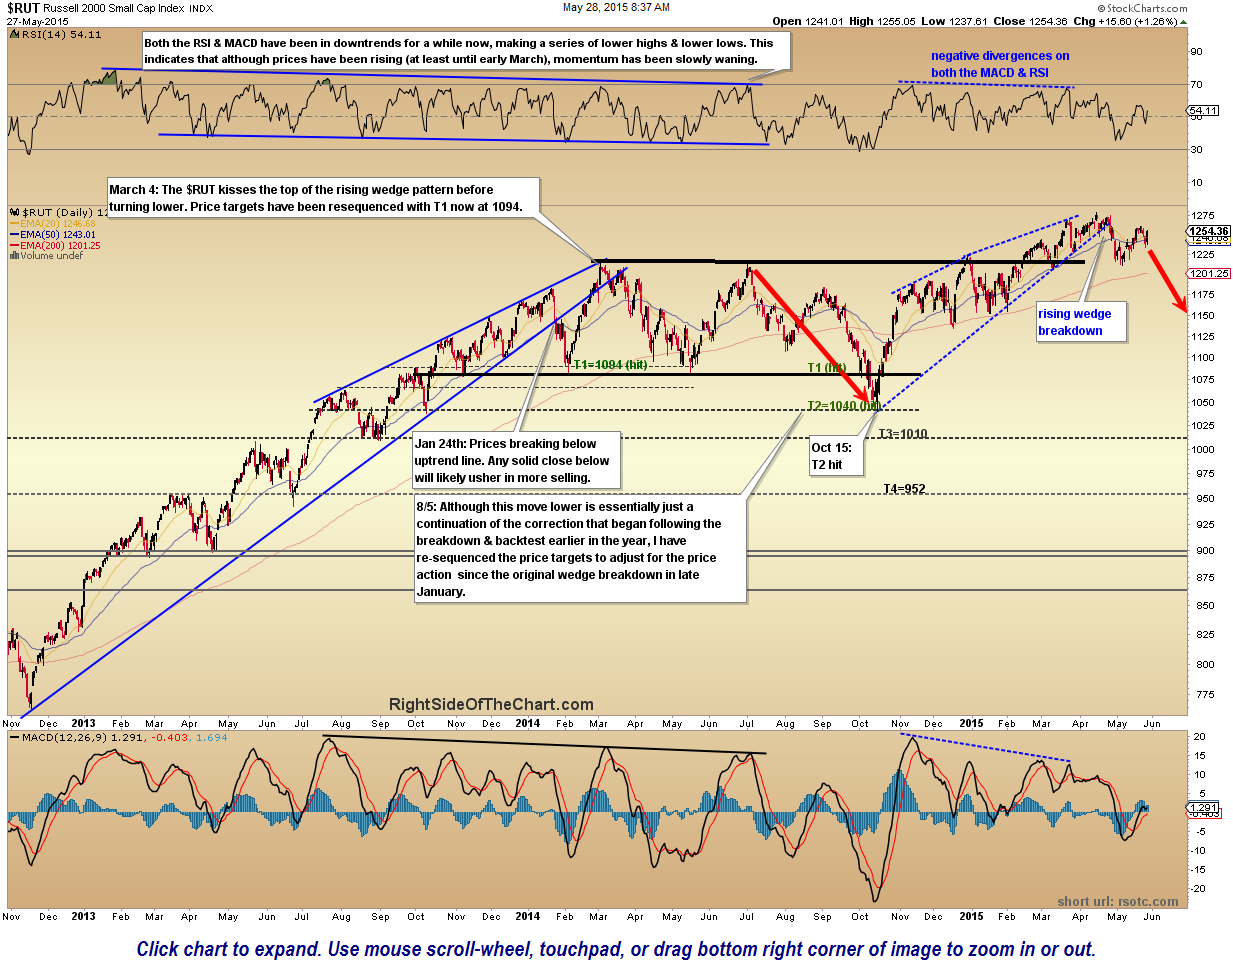
$RUT daily May 27th
In summary, the intermediate & longer-term outlook for the US markets remains bearish IMO but the trends on just about every time frame (short, intermediate & long-term) remain bullish and so while I wouldn’t consider adding new long exposure to the broad markets at this time, I can’t make a solid case to initiate new short exposure just yet either, although that could change any day now.
So far 2015 is shaping up to be a traders (vs. investors) market with the broad market ($SPX) up less than 3 1/2% YTD. This market has been more conductive to going long or short individual stocks or sectors with the best R/R profiles & technical patterns & I believe that will be the case going forward, likely throughout the remainder of the year. I also think that right now is a good time to keep things light as I’m not seeing too many attractive trade setups at this time but I’m always on the lookout for new trade ideas and welcome any feedback or potential trade ideas that you might be watching.