
Following the recent divergent low & multiple breakouts above both downtrend line & price resistance levels, /DX (US Dollar Index futures) hit my 90.611 price target, followed by the expected reaction with a pullback to the former 89.939 resistance (now support) level overnight which was then followed by a reversal off the backtest of that support so far today. While the pullback to the 89.939 support offered an objective long entry or add-on to a long position on the $USD, the next buy signal/objective entry will come on a break above the recent highs which should open the door to the next price target around 91.081. 60-minute chart below.
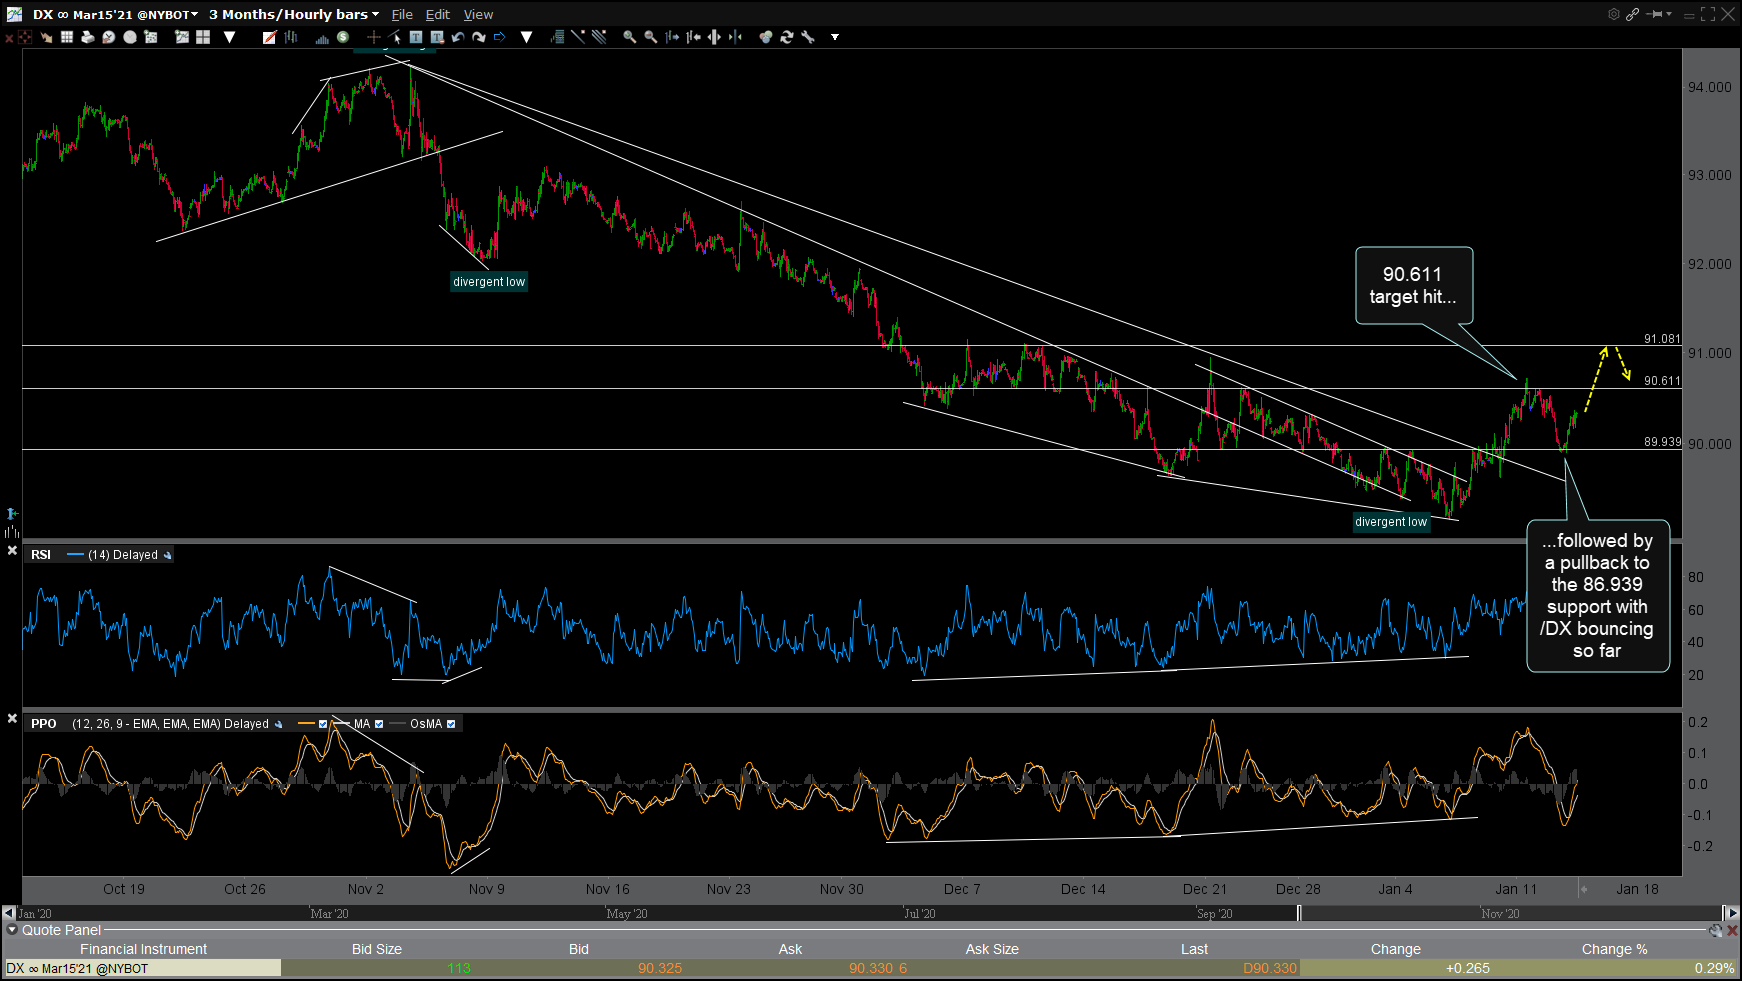
DX 60m Jan 13th
/ZN (10-year US Treasury Bond futures) is reversing after putting in a divergent low on the 120-minute period time frame. Should the US Dollar continue to rally substantially from here, putting pressure on the stock market as I suspect, that would likely be the catalyst for additional upside in Treasury bonds that could take /ZN up for another test of the downtrend line (top of triangle pattern).

ZN 120m Jan 13th
Should the $USD continue to rally, IWM (small caps) along with the large-cap stocks will most likely reverse course: A big “IF”, as the trend in the stock market remains bullish for now, but an if certainly worth monitoring, IMO, especially with the Nasdaq 100 recently breaking below & backtesting the trendline off the early November lows after putting in a divergent high.
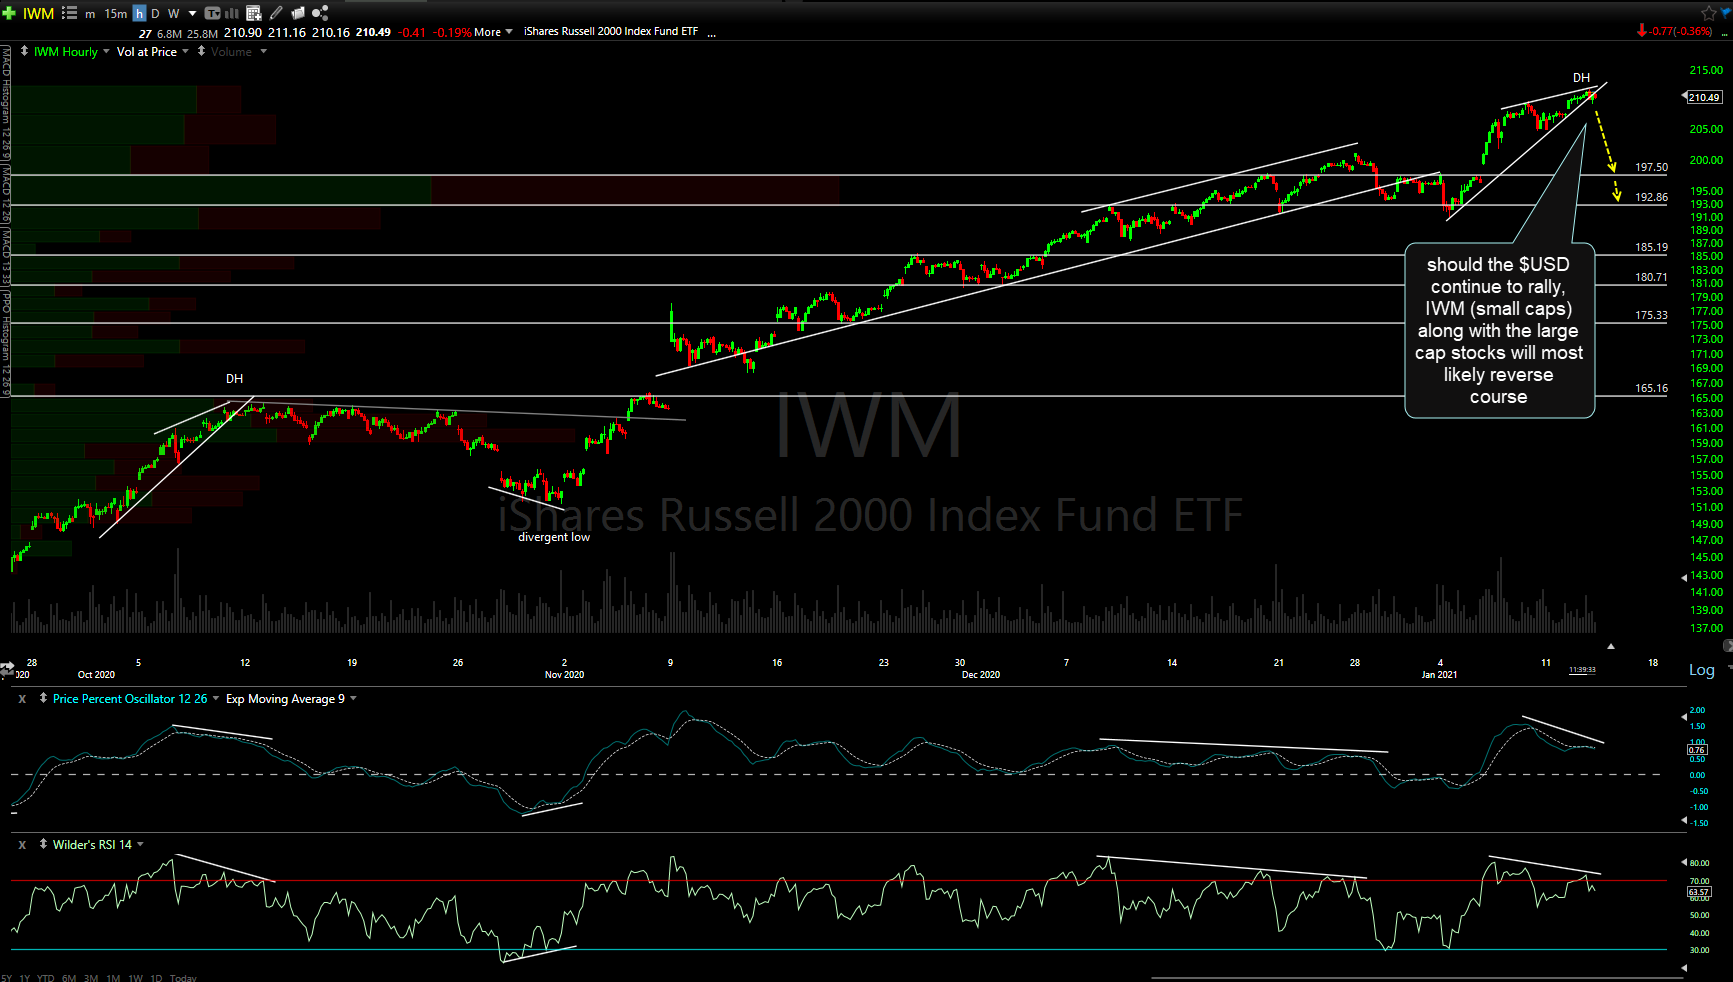
IWM 60m Jan 13th