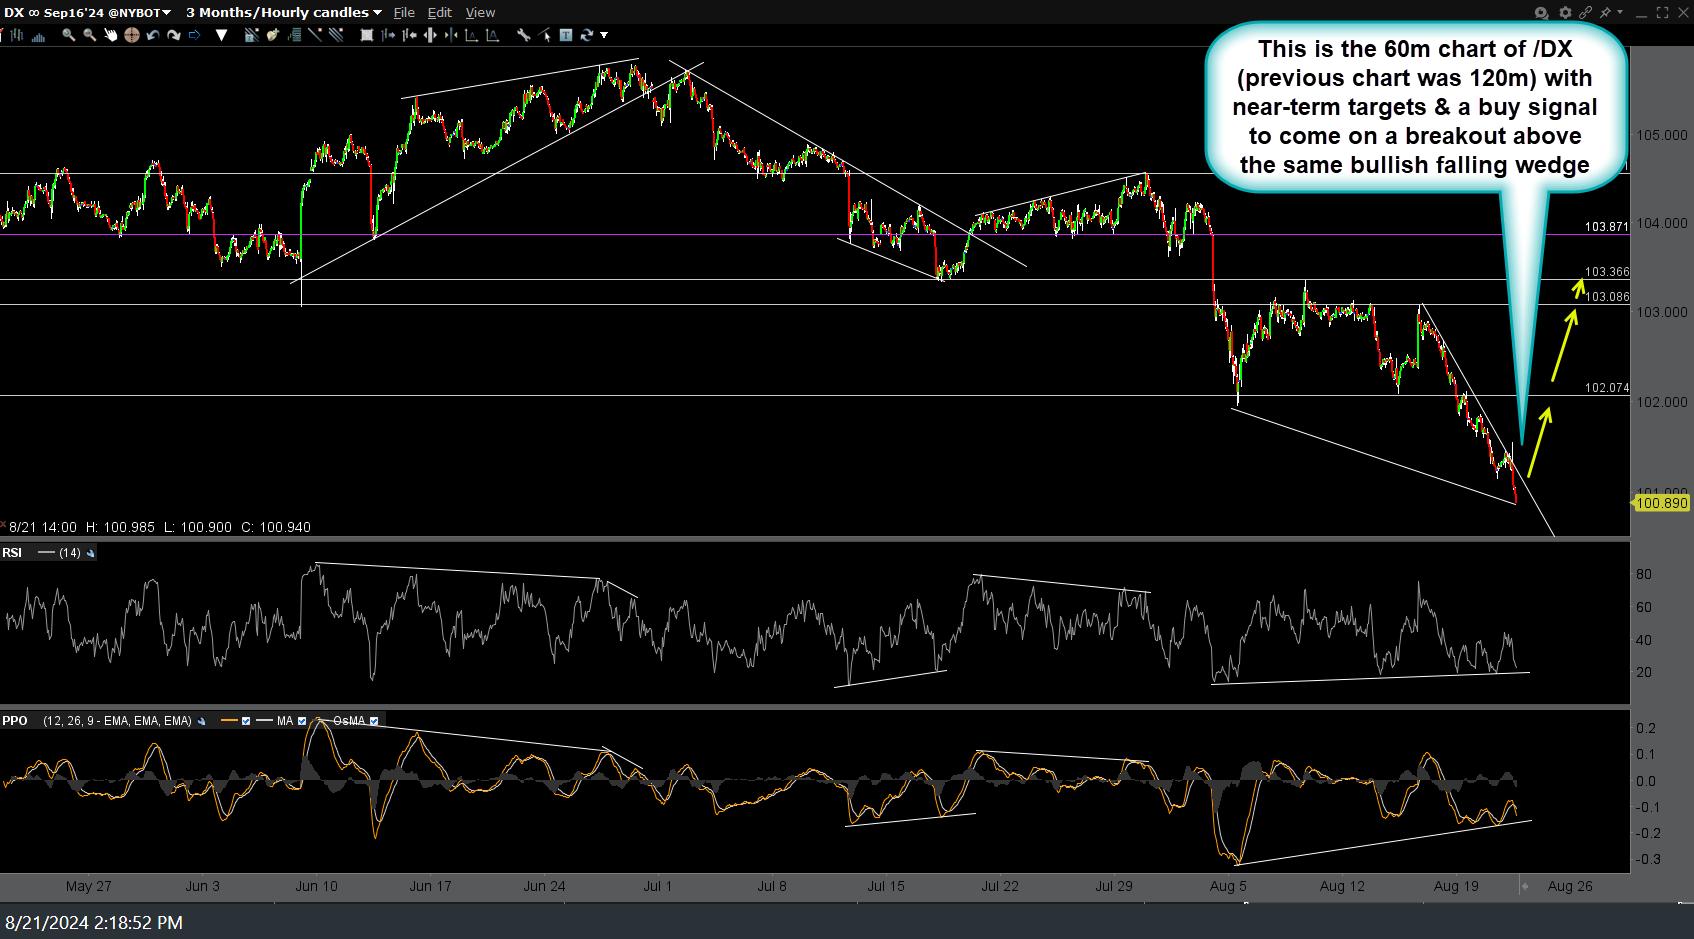
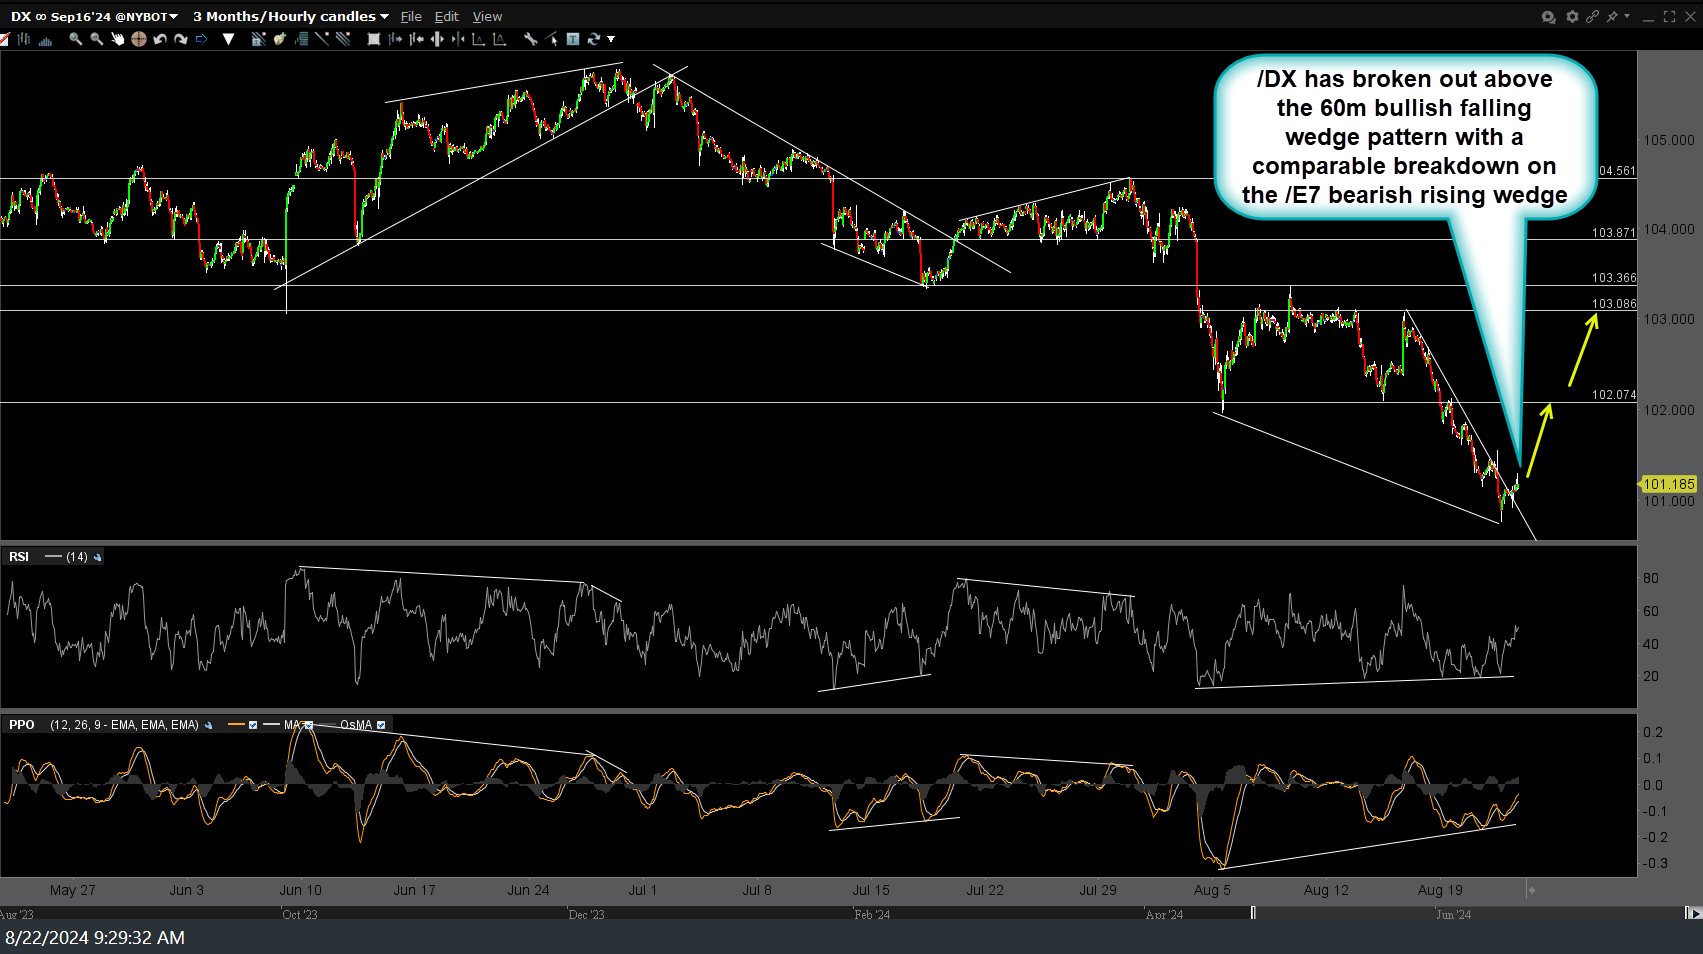
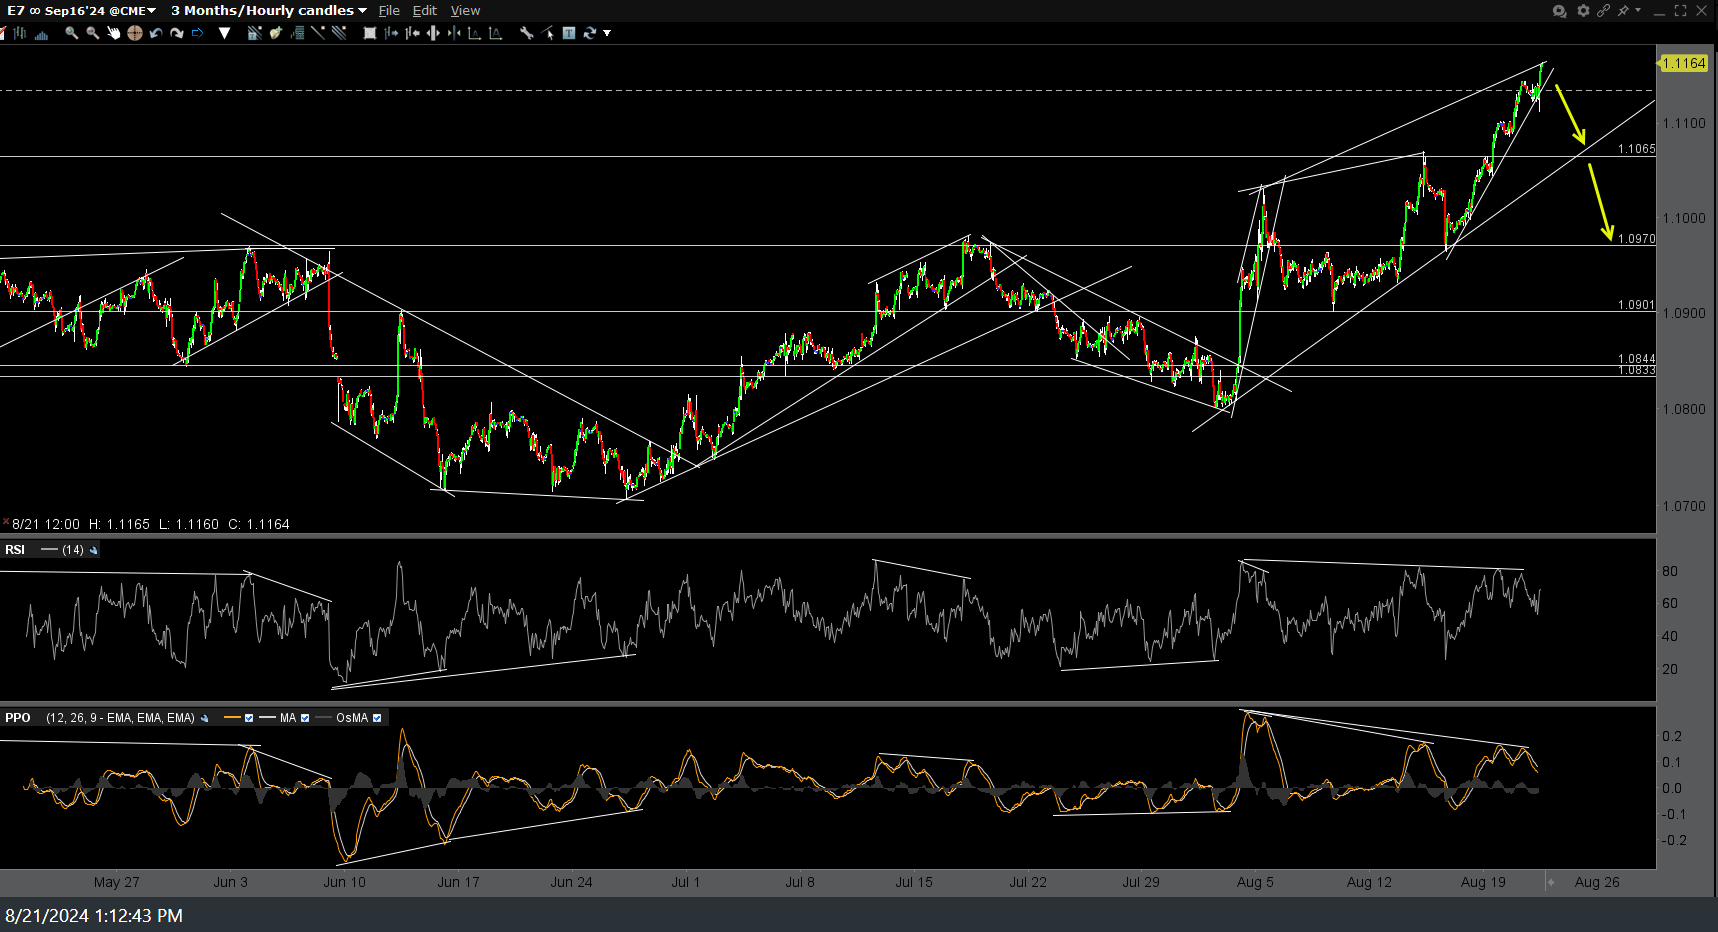
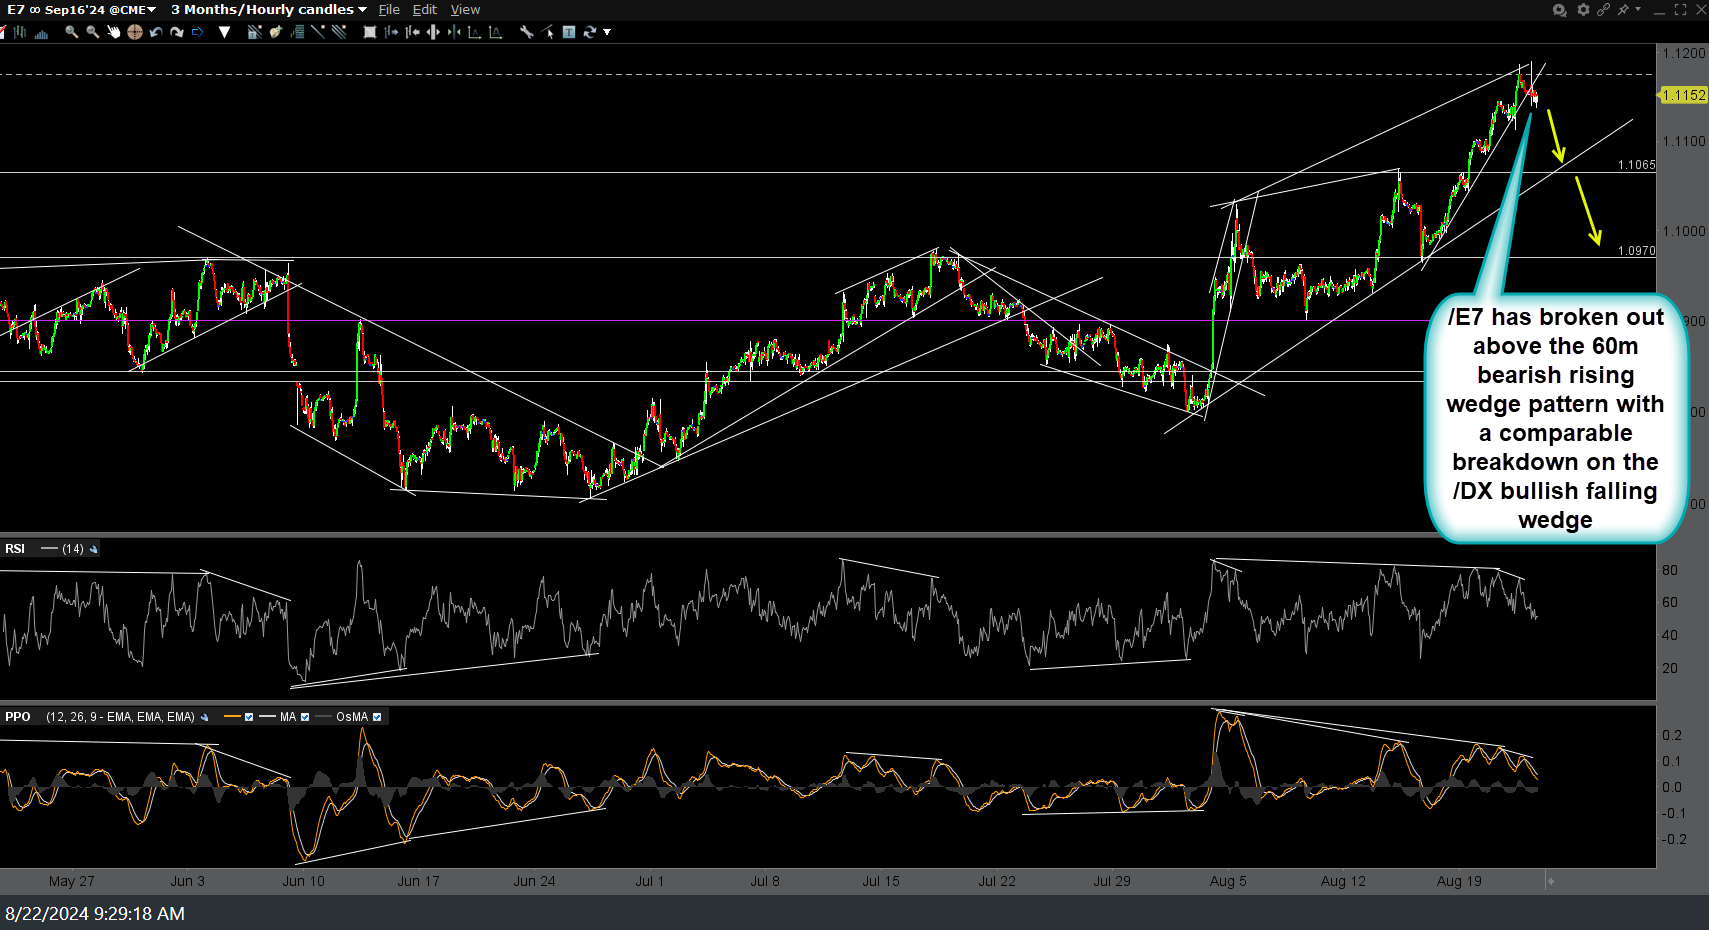
/DX (US Dollar Index futures) has broken out above the 60m bullish falling wedge pattern with a comparable breakdown on the /E7 (Euro futures) bearish rising wedge. Previous & updated 60-minute charts below. See yesterday’s post for comparable price targets on UUP (US Dolllar ETN) & FXE (Euro ETN).
A couple of things to keep in mind regarding the US Dollar:
- Any comments from Fed Chairman Powell at the Jackson Hole Summit tomorrow that are perceived as either dovish or hawkish in a vacuum (i.e.- on face value) have the potential to be offset by hawkish or dovish comments from other central banks, especially the ECB & BOJ as the price of the US Dollar Index is a function of the other currencies in the $DXY, with the Euro & Yen being, by a wide margin, the largest.
- Both the stock market & gold are typically inversely correlated to the US Dollar: i.e.- A falling Dollar is typically bullish for stocks & gold & vice versa (bearish when USD is rising). That correlation isn’t iron-clad as there are periods of brief disconnects of the inverse correlation but typically, the longer & larger the disconnect, the more powerful the mean reversion (like the 16% plunge in QQQ that followed the large disconnect between QQQ & EUR/USD I was highlighted shortly before QQQ peaked in early July).
- A long on the US Dollar (or short on the Euro) based on the current technical posture & today’s breakouts can either be a pure-play trade and/or an indirect hedge to any stock index shorts.
- As currency moves are relatively small in percentage terms (FOREX pricing is measured in PIPs, i.e. 1/100th of 1% or 0.0001), one would make a positive (upwards) beta-adjustment to their position size if trading any of the ETNs such as UUP or FXE) to account for the below-average gain/loss potential.
+2


