
With the GDX swing trade currently pushing the limits of the stop, which was revised to any close below yesterday’s low of 19.88, I wanted to share my thoughts & some additional analysis.
First off, I wanted to share some charts that illustrate the very strong inverse correlation between the US Dollar & gold. The first chart below is a 2-year daily chart of UDN (green) & the gold ETF, GLD (yellow). UDN is the bearish (inverse) US Dollar ETN so by using that vs. $USD or UUP, it provides for a much easy visual of the inverse correlation by showing the positive correlation between these two instead (i.e.- both are moving up & down at the same time).
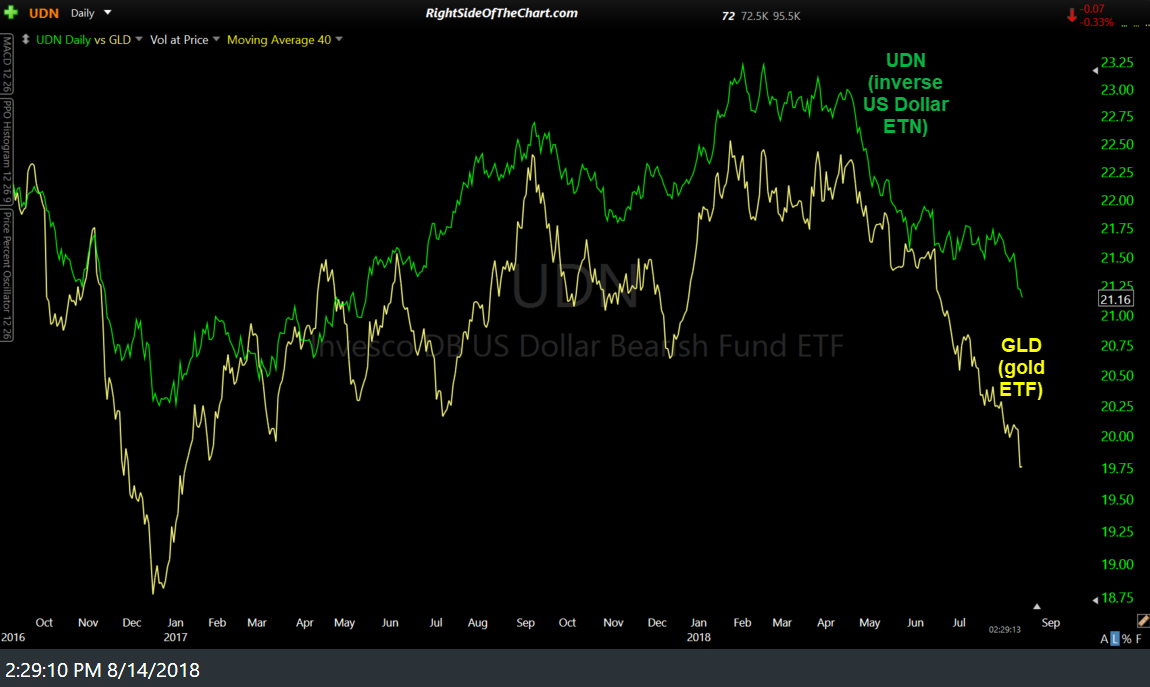
GLD vs UDN Aug 14th
As the Euro is, by far, the largest component of the US Dollar index at a 57.6% weighting, I will often use the charts of EUR/USD as a proxy for trying to determine where the US Dollar is headed. Keep in mind that the EUR/USD is the Euro vs. the Dollar & as such, when the price of that forex pair is rising, the dollar is falling & vice versa, similar to the UDN chart above. As this comparison of GLD & EUR/USD shows, the same very clear correlation exists between the two. Also keep in mind that with just above any price correlations between two different securities or asset classes, temporary disconnects of the relationship are not uncommon so best to focus on the larger trends.
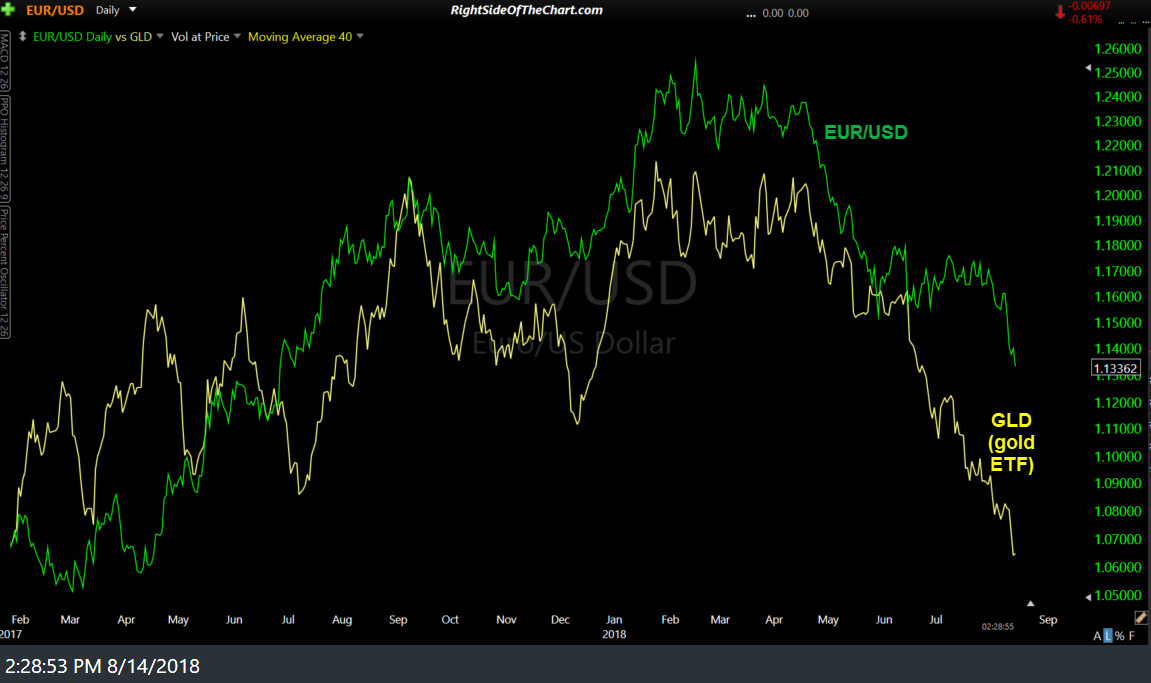
GLD vs EUR-USD daily Aug 14th
Now that we’ve established the clear inverse correlation between the US Dollar & the price of gold, or in this case, GLD, which is priced in US Dollars, hence the reasoning behind the correlation (a stronger dollar buys more gold per ounce, a weaker dollar buys less gold per ounce), let’s take a look at the charts of EUR/USD to try to gauge where the $USD and gold are headed.
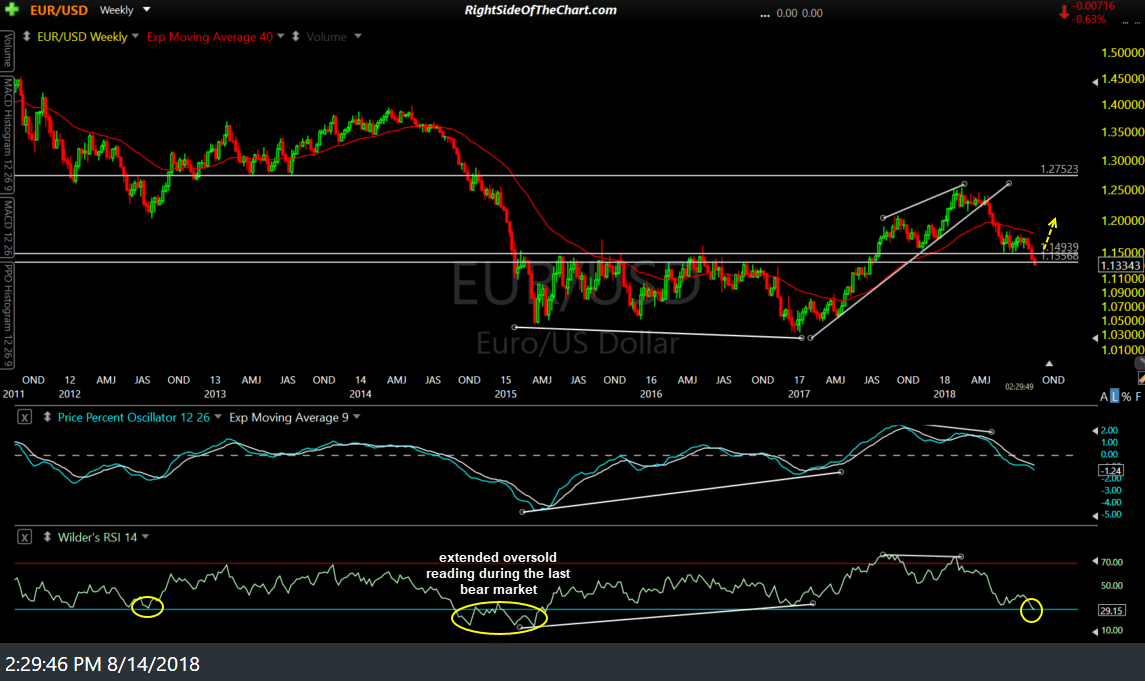
EUR-USD weekly Aug 14th
Starting with the big picture & as highlighted in recent updates, EUR/USD has fallen to a key support zone on the weekly time frame (above). That support zone is defined by the top of the 2½ year basing pattern/sideways trading range in the pair as well as the successful backtest of the top of the range that followed the breakout above the range back in July 2017. Also, note the rarely seen oversold (30 or below) reading on the weekly RSI.
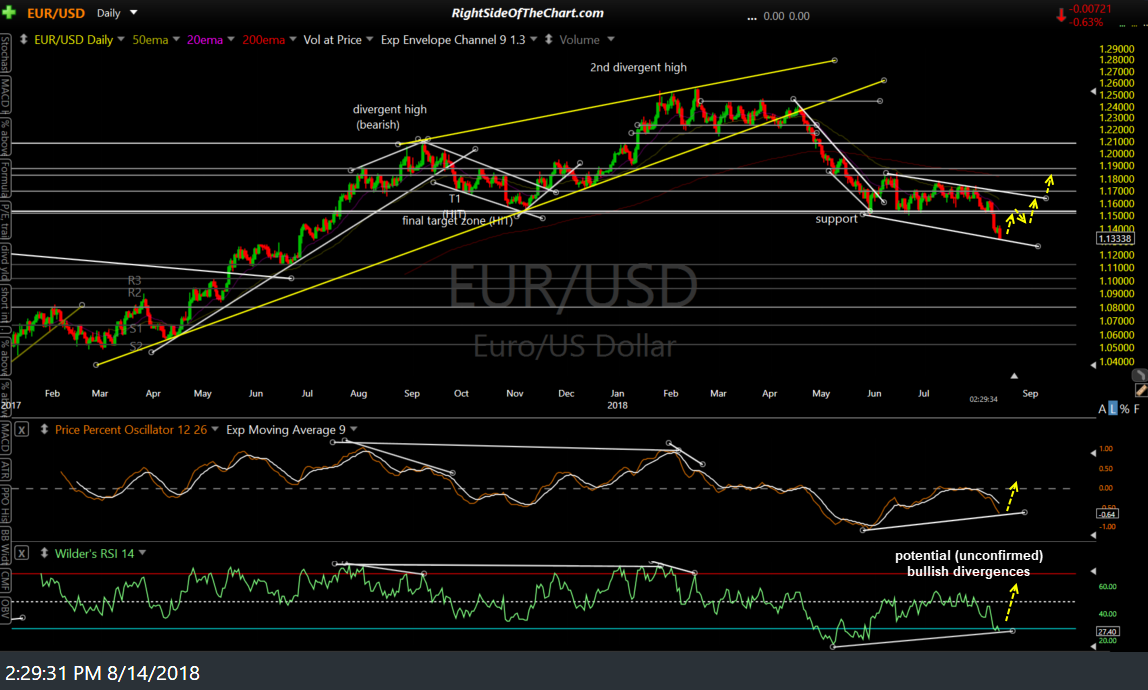
EUR-USD daily Aug 14th
Moving down to the daily time frame, EUR/USD also has some strong potential divergences building on the RSI & PPO which would be confirmed via a bullish crossover on the PPO is the pair reverses soon, especially if my bear trap/false breakdown scenario plays out. Adding to the case to a potential trend reversal & rally is the fact that there are also some fairly strong potential divergences now building on the 60-minute chart of EUR/USD (below) as well.

EUR-USD 60-min Aug 14th
Bottom line: Should the potentially bullish developments forming on the charts of the EUR/USD, which are bearish developments for the US Dollar, play out soon, that would greatly increase the chances for a substantial rally in gold & GDX. Sometimes gold will lag behind a move in the US Dollar just as GDX, at times, will lag behind a move/trend reversal in gold but those disconnects are usually fleeting & followed by a game of ‘catch up’ or ‘follow the leader’.
Should EUR/USD continue to fall much below the bottom of this support zone, then the odds for a continued fall down to the 1.085ish support level & quite possibly the 1.047ish support area/bottom of the 2015-2017 trading range would increase substantially.
On a final note, GDX is currently trading about 0.40% below yesterday’s low of 19.88 with GLD currently trading green & throughout most of the trading session today. Everyone should decide their own stop if long GDX but regarding the official trade, I might post an update with another revision to the suggested stop shortly before the close, depending on how the $USD, gold & GDX trade over the next 30 minutes or so.