
Until & unless this breakdown below the 1.207 & TL support fails my expectation remains for additional downside in the Euro/upside in the $USD which will likely result in a correction in the Dollar-sensitive assets such as stocks, oil, & select commodities. EUR/USD daily chart below.
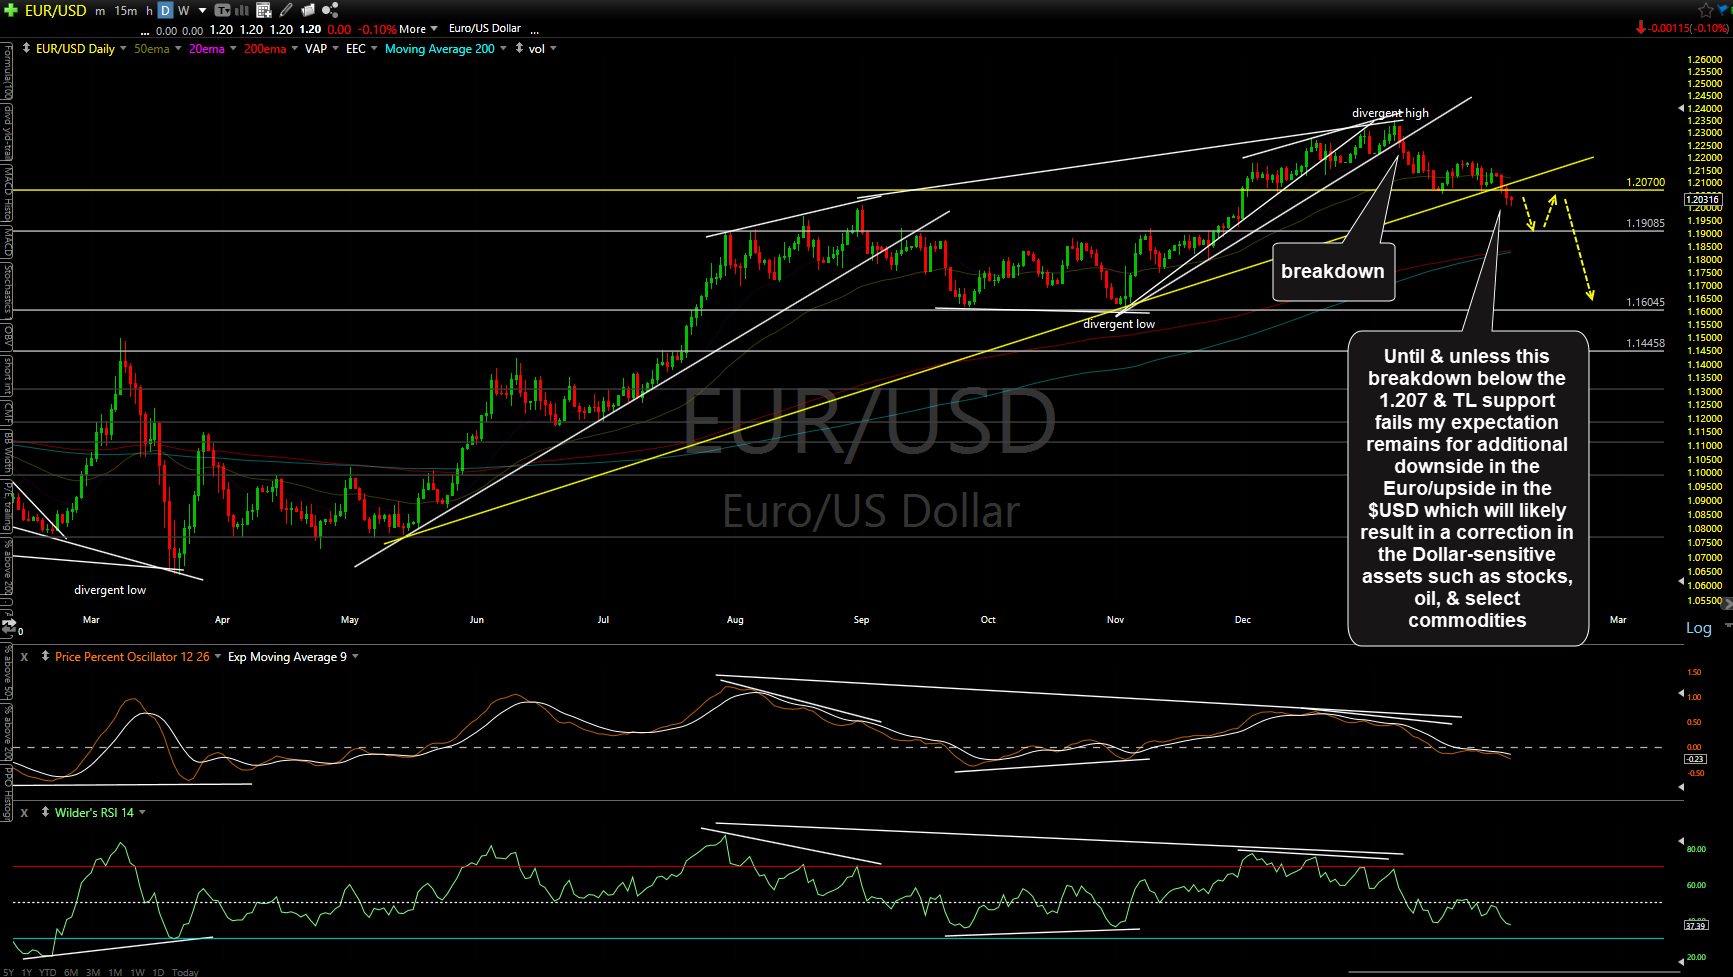
EUR-USD daily Feb 3rd
/DX (US Dollar futures) remains above the 91.081 price & uptrend line support levels as the biggest divergences between the stock market, oil, & other Dollar-sensitive assets in quite some time continues. 60-minute chart below.

DX 60m Feb 3rd
/E7 (Euro futures) remains below the 1.2066-1.2091 support level (T2) keeping the Euro on a sell signal intact for now although the positive divergences all also still intact for now. Red arrow shows the preferred scenario, green arrows show whipsaw/alternative scenario. 60-minute chart below.
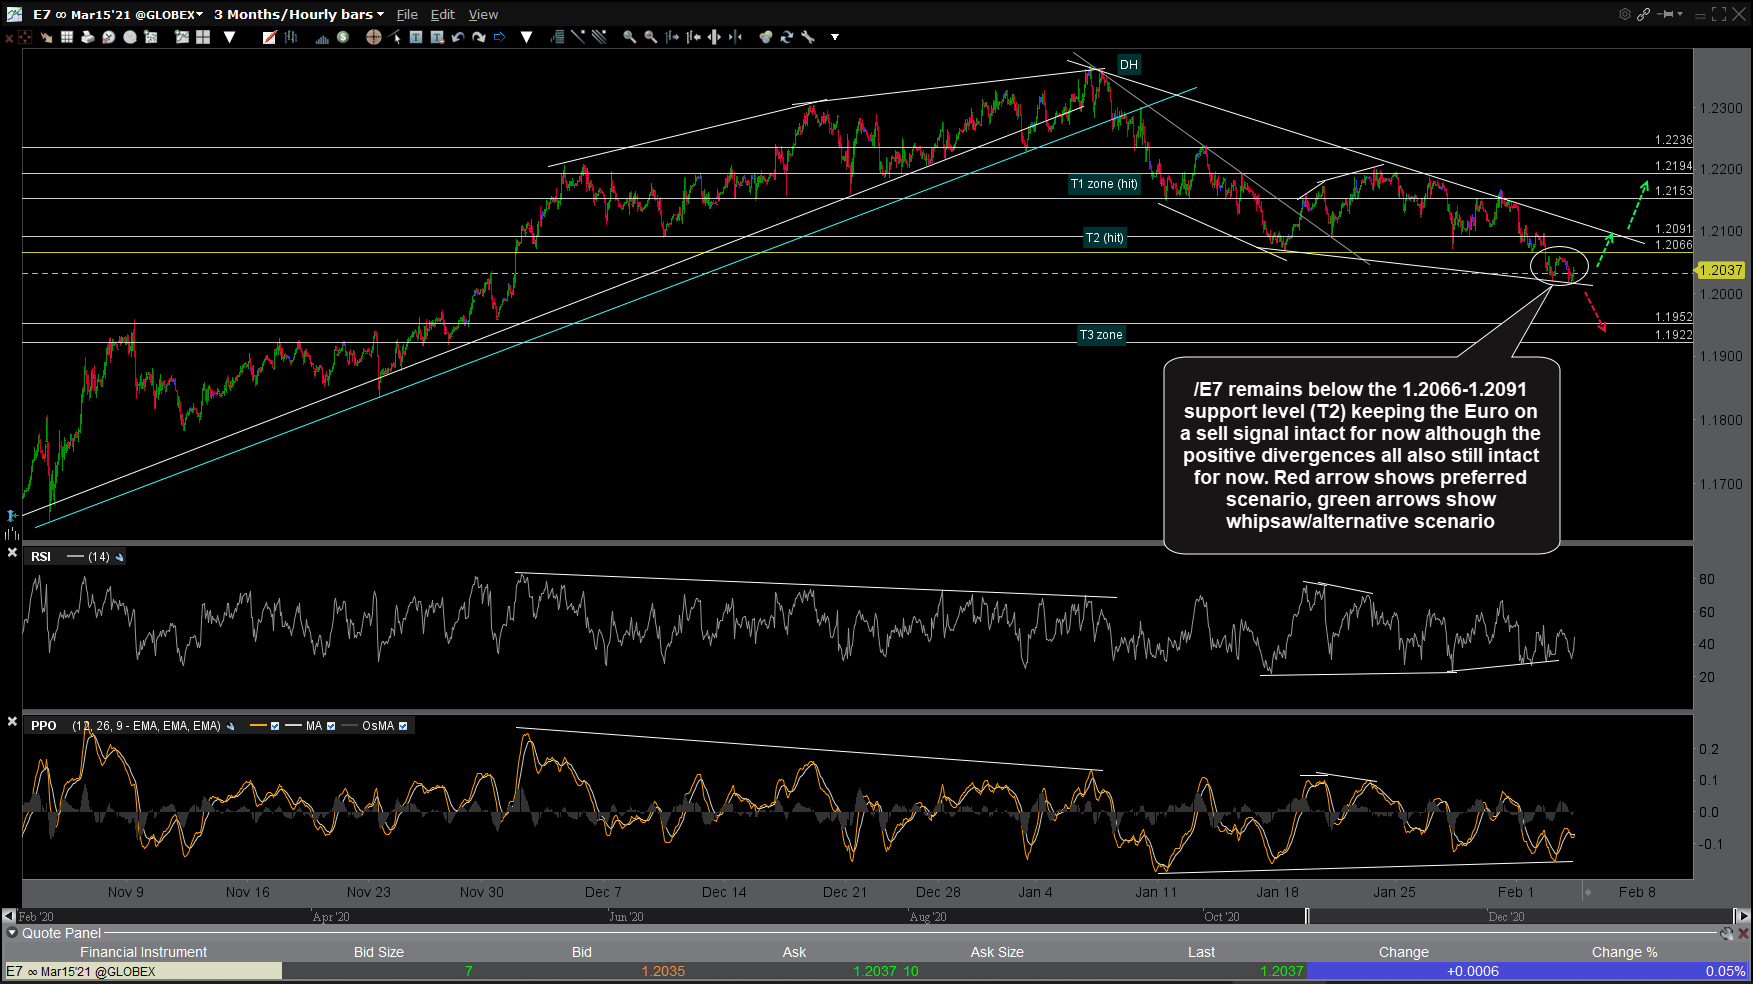
E7 60m Feb 3rd
Now that the last of the market-leading FAAMG+T stocks have all reported, we should soon know whether Friday’s breakdown or yesterday’s snap back above the trendline in QQQ was the whipsaw signal. Red scenario still preferred although most likely contingent on additional gains in the $USD. Daily chart below.
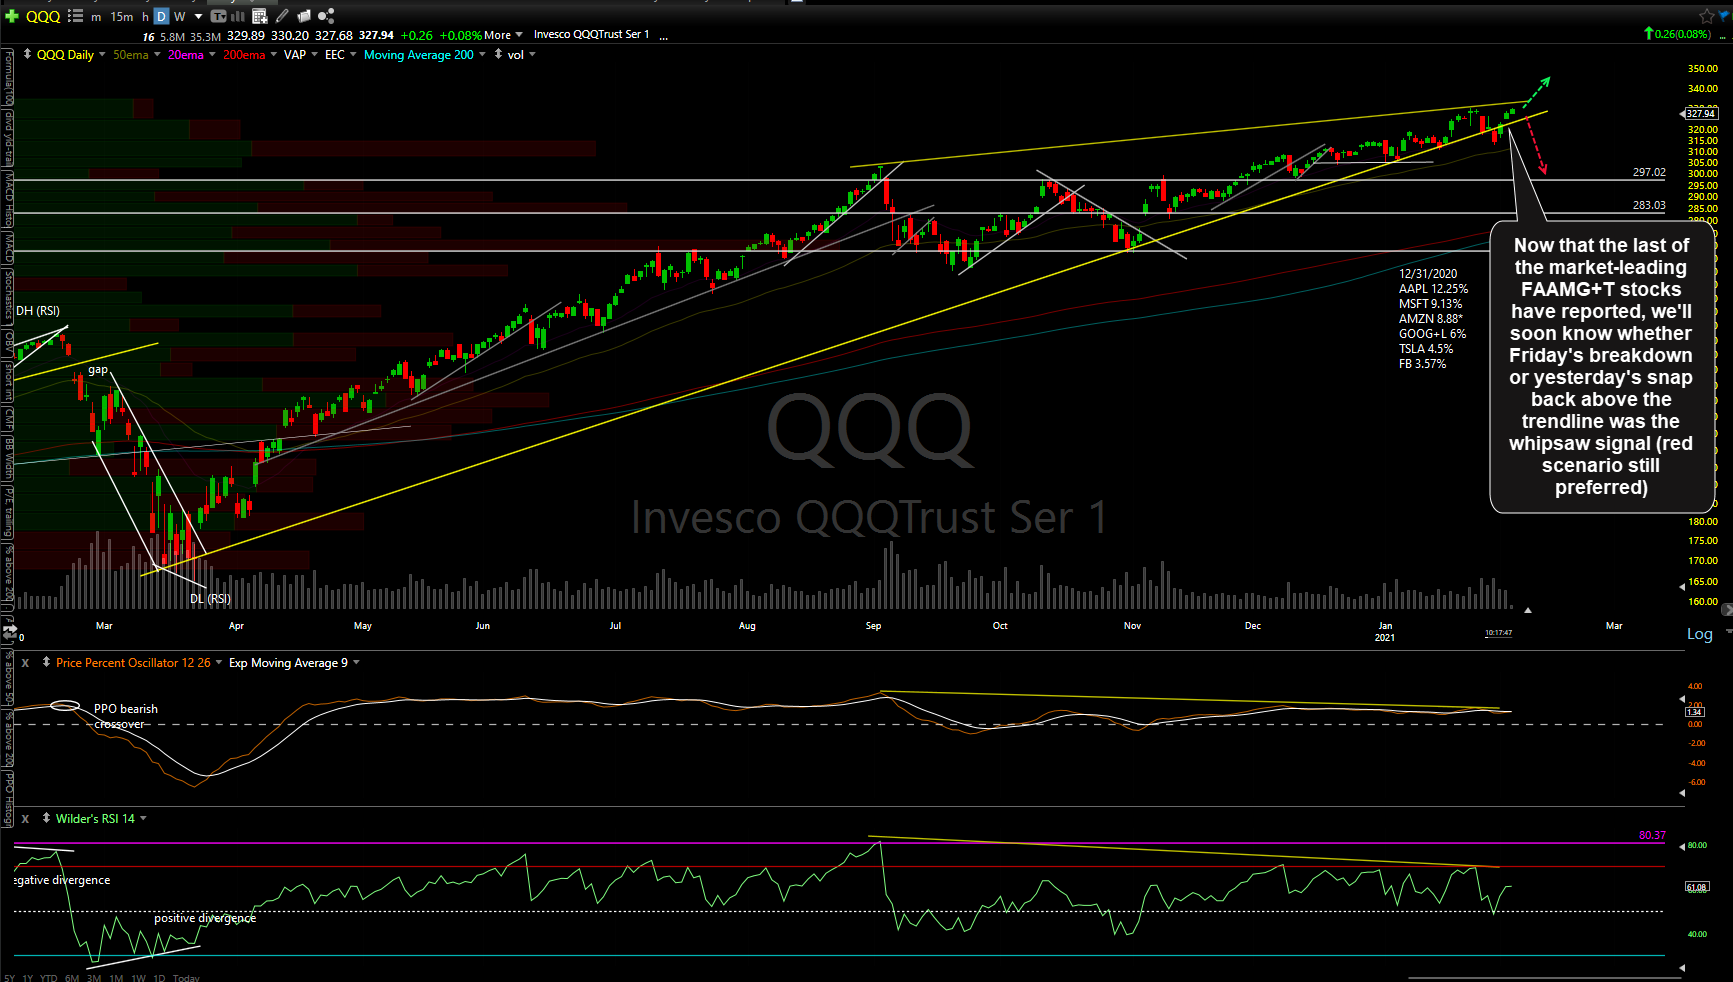
QQQ daily Feb 3rd