
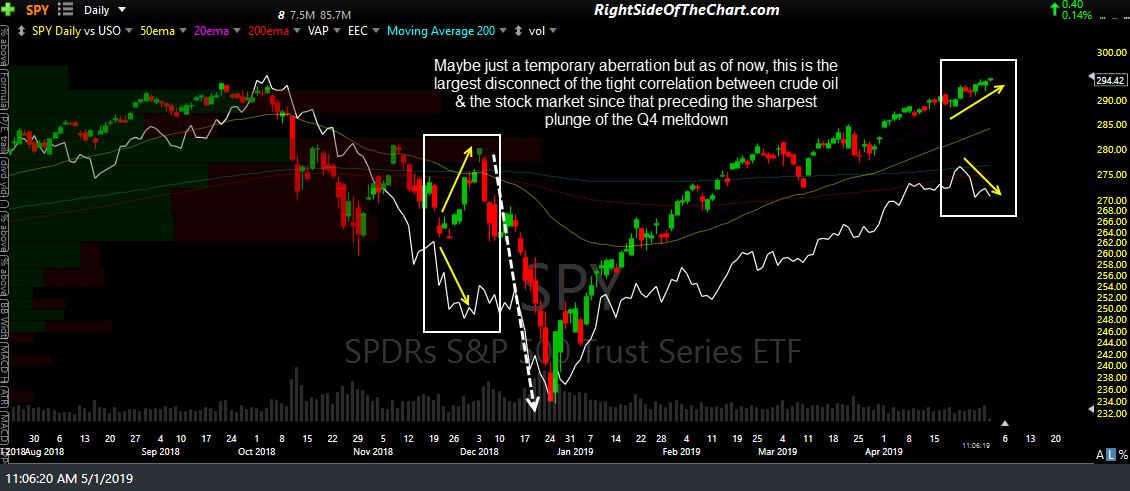
It will be interesting to see how much longer the stock market can rise if crude continues to move lower as the two have been highly correlated for at least the past 2 years. Maybe a brief aberration that will correct itself soon with a mean reversion (crude up and/or equities down) but as of now, this is the biggest disconnect between the two since just before the sharpest plunge of the Q4 correction. Daily chart below shows SPY with the candlesticks overlaid with USO (crude ETN) as the white line.
SPY vs USO May 1st