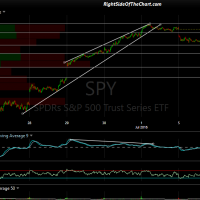
Despite the decent drop in the markets today, nothing has changed in the longer-term technical outlook. The first chart below is the last set of 5 minute charts on the broad market tracking ETFs that I had posted within the trading room on Friday. Those sell signals that were triggered on Friday continued to play out into today after the long 3-day holiday weekend & will likely continue to play out this week although anything goes as this abbreviated trading week is historically marked by low volume.
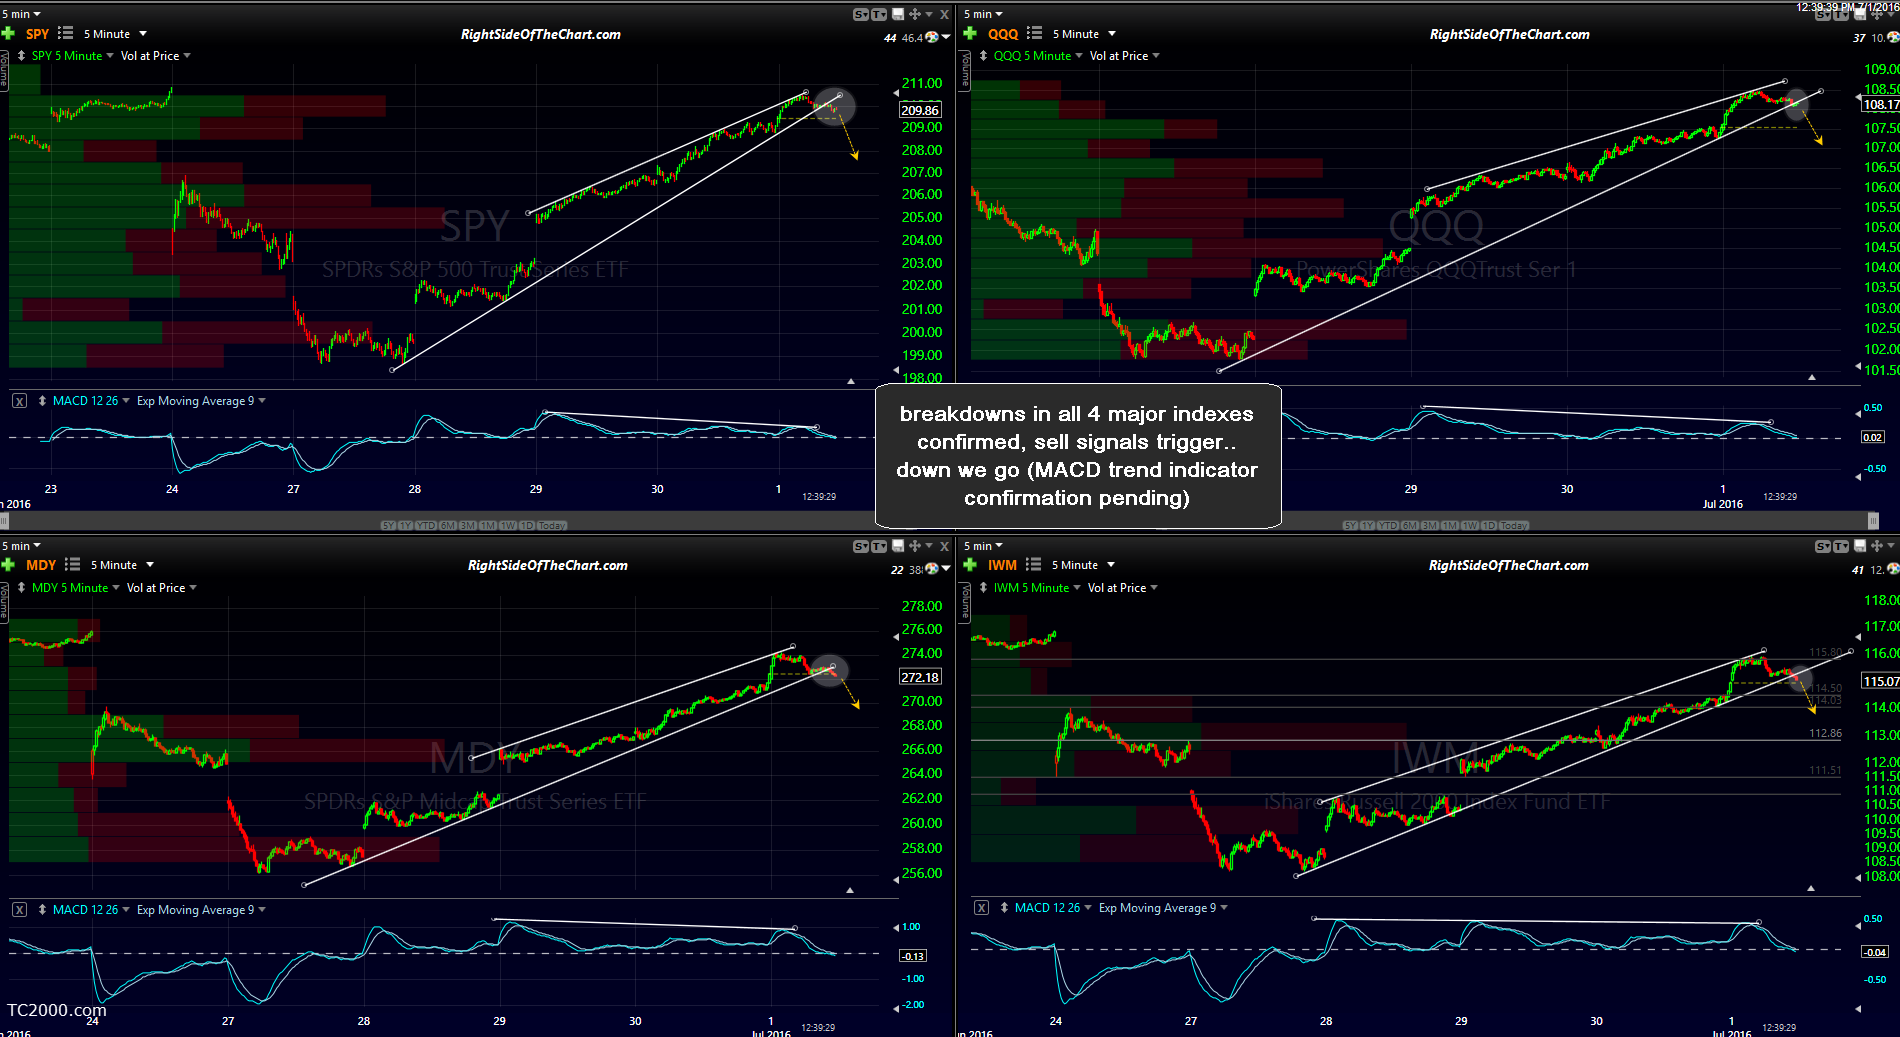
quad-5-min-charts-2-july-1st
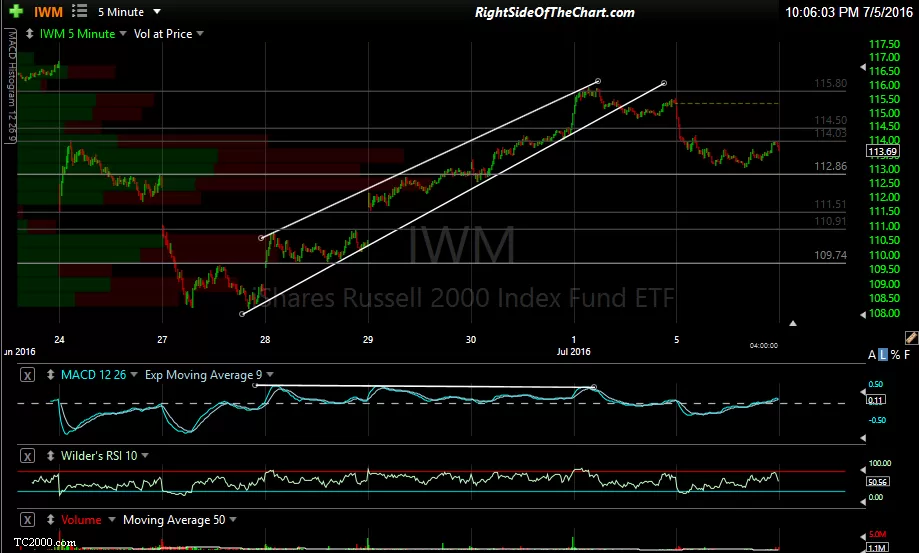
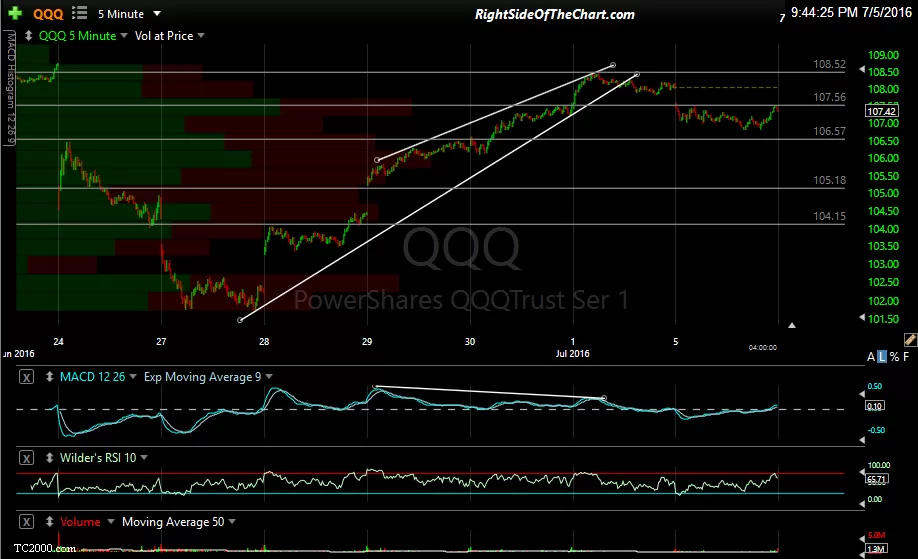
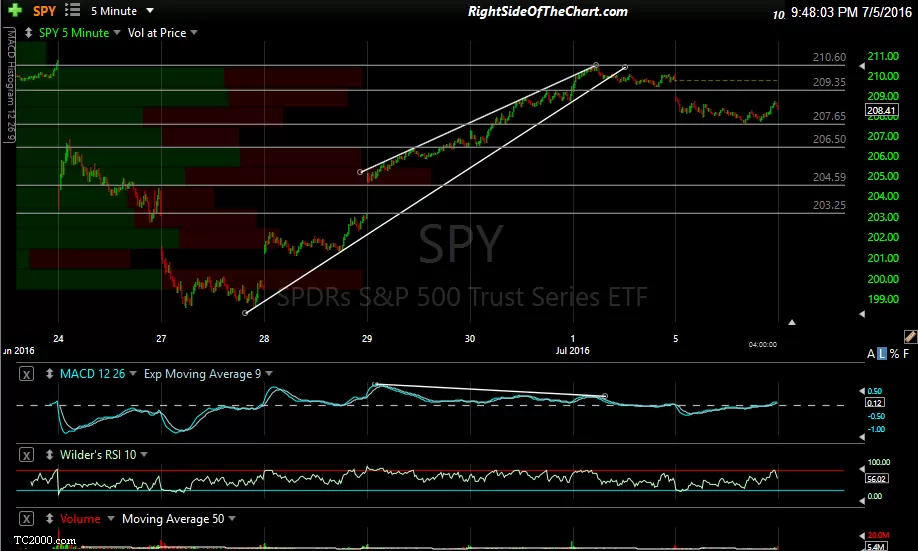
On the updated charts below (as of today’s close) I have added a few more support & resistance levels to watch for this week. A move over Friday’s highs would obvious be near-term bullish while each & every break of the support levels below will strengthen the bearish case as last week’s strong rally is chipped away, piece by piece. I’ll work on posting a more comprehensive market overview and/or video sometime this week & I will continue to reply to any questions or private messages asap as I’ll be in a semi (part-time) working vacation mode over the next week.
-
- QQQ 5 min July 5th
-
- SPY 5 min July 5th
-
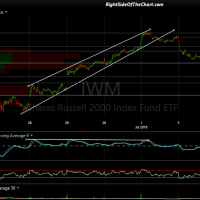
- IWM 5 min July 5th