
TLT (20+ year Treasury Bond ETF) has made an impulsive breakout above the key 122.50ish resistance level which does not bode well for the stock market, as this indicates both a flight-to-safety from institutional investors (i.e- the ‘smart’ money) as well as an increasingly pessimistic view of future growth & inflation expectations for the US economy.
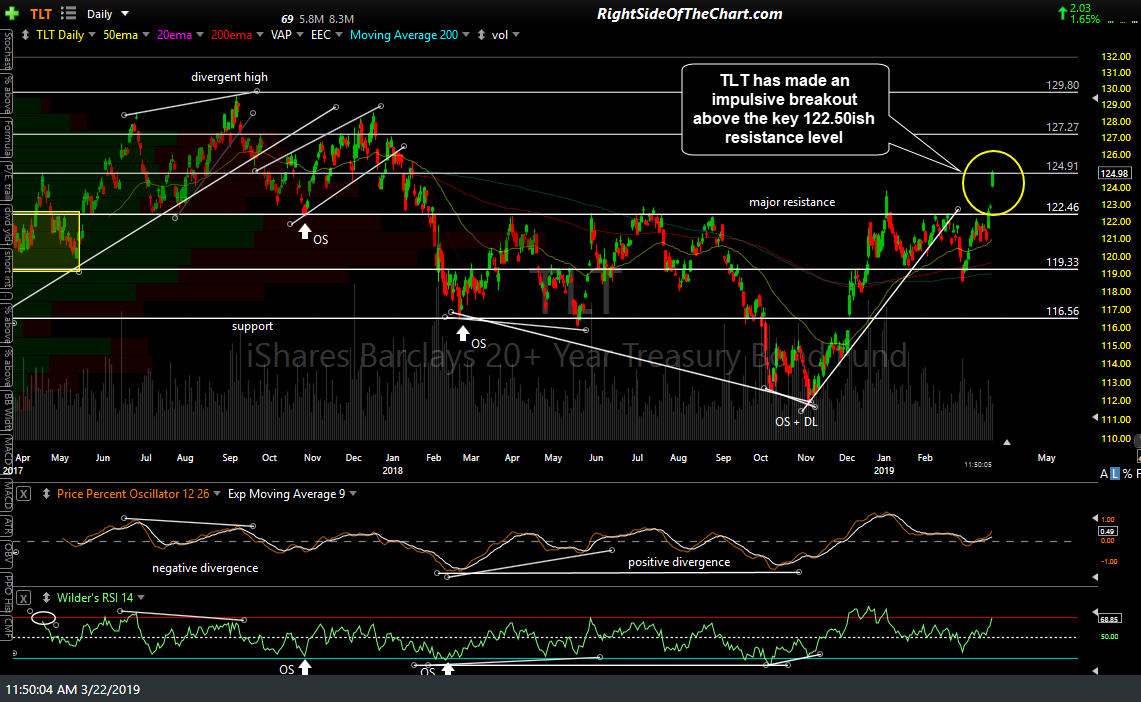
TLT daily March 22nd
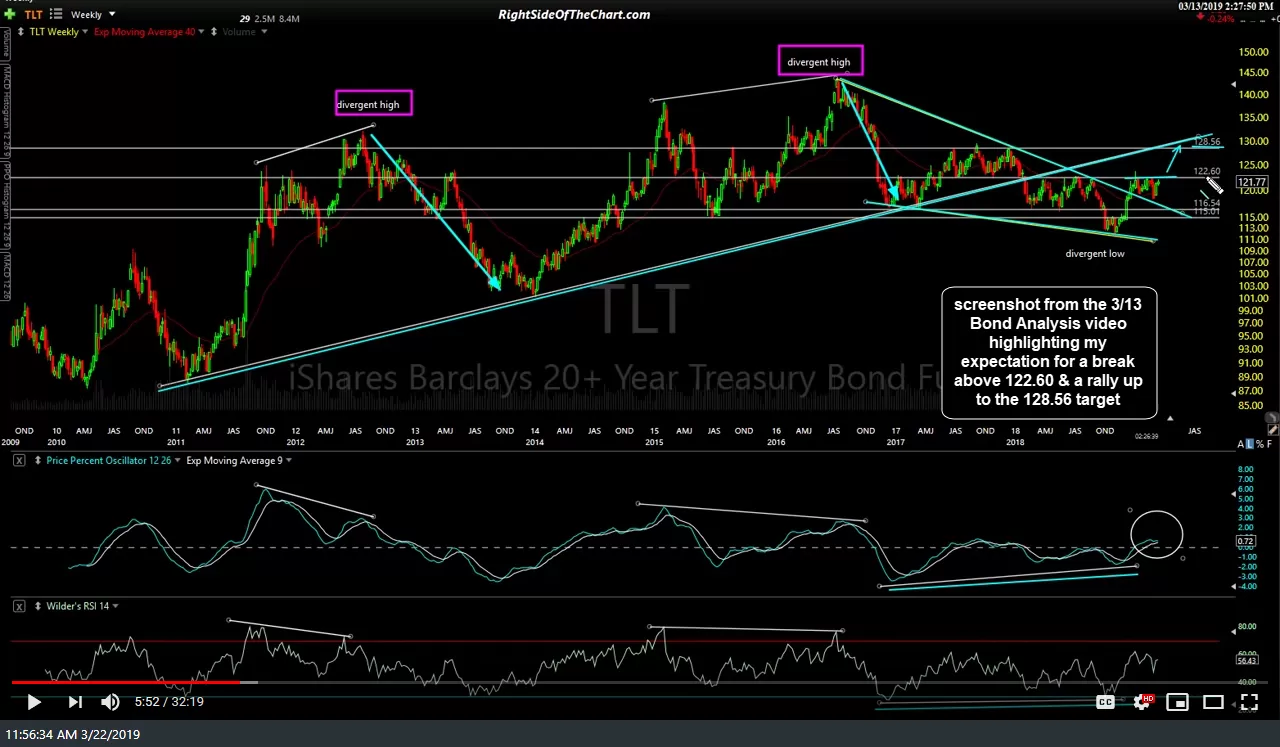
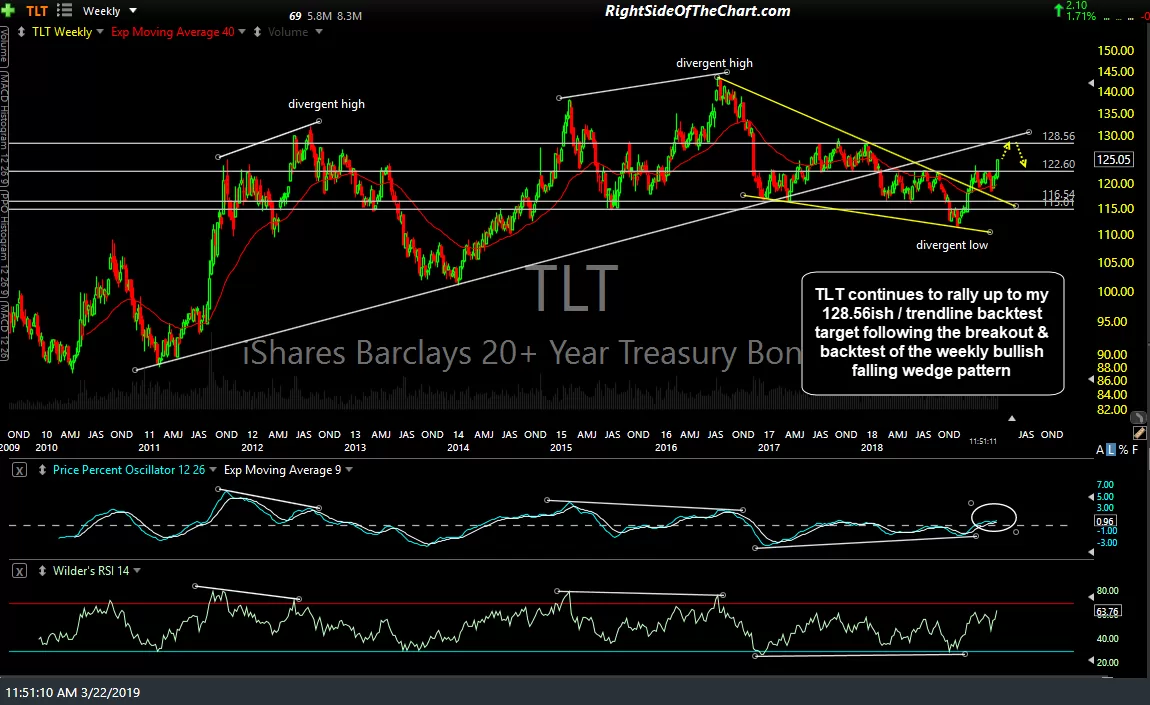
Since the latter half of 2018 & throughout 2019, I have been highlighting the large bullish falling wedge pattern on the weekly charts of TLT, looking for a rally up to the intersecting 128.56 resistance level & primary uptrend line which TLT broke down below in early 2018. Today’s impulsive rally which puts the 122.50-122.60 level clearly behind TLT helps to increase the odds that scenario will play out & if so, that doesn’t not bode well for the US stock market, which tends to move opposite of Treasury bond prices.
-
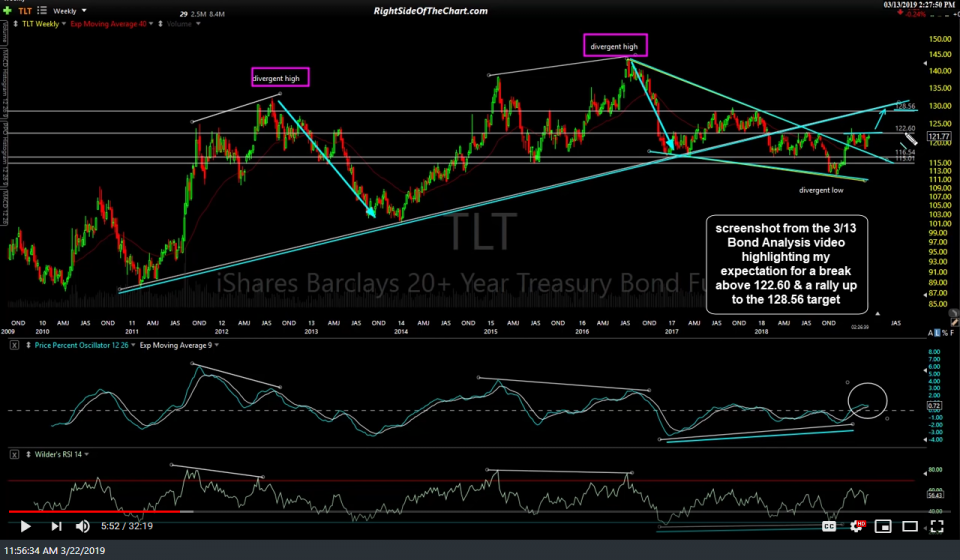
- TLT weekly screenshot 3-13-19
-
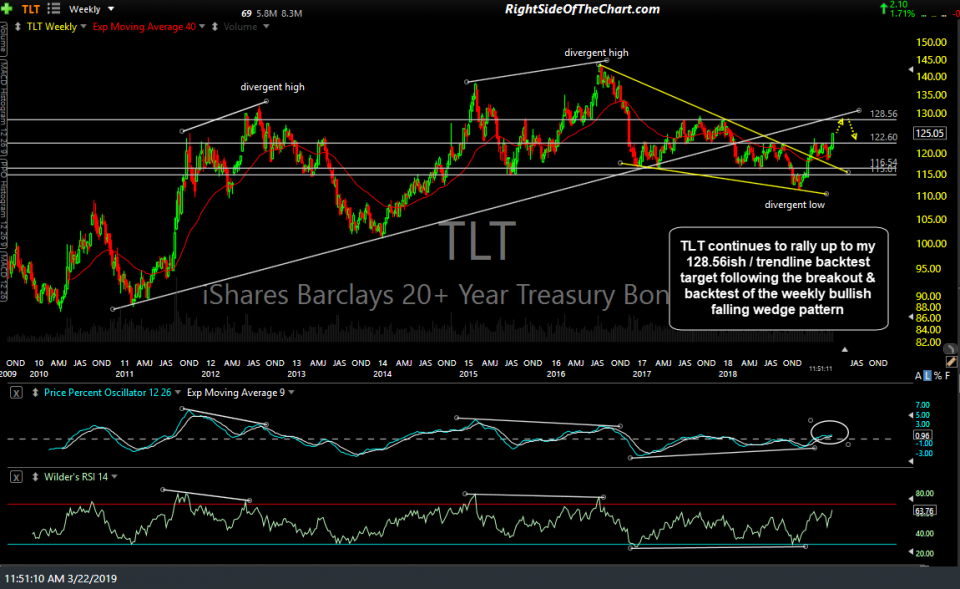
- TLT weekly March 22nd
As I like to say, one day does not make a trend & we’ve seen plenty of whipsaw signals recently so we’ll just have to continue to monitor the price action in Treasuries as well as equities next week to see whether or not we get follow-through to the breakout in Treasuries and the sell-off in equities following the failed breakout in SPY earlier this week. Also, keep in mind that at this point in time, it is a bit pre-mature for me to refer to the move above the key 282ish support level in SPY & subsequent fade of that rally as a “failed breakout” as SPY is essentially backtesting (or just a hair below) that support level as I type. Therefore, next week (once again) has the potential to provide some significant insight as to where the market is headed in the coming weeks/months.