
The potential third & final price target for the recent TLT (20-30 yr Treasury bond ETF) short trade has now been hit. Watching TLT closely as it is getting close to testing & potentially breaking the recent multi-year lows (i.e.- new highs in rates). Previous & updated 60-minute charts below.
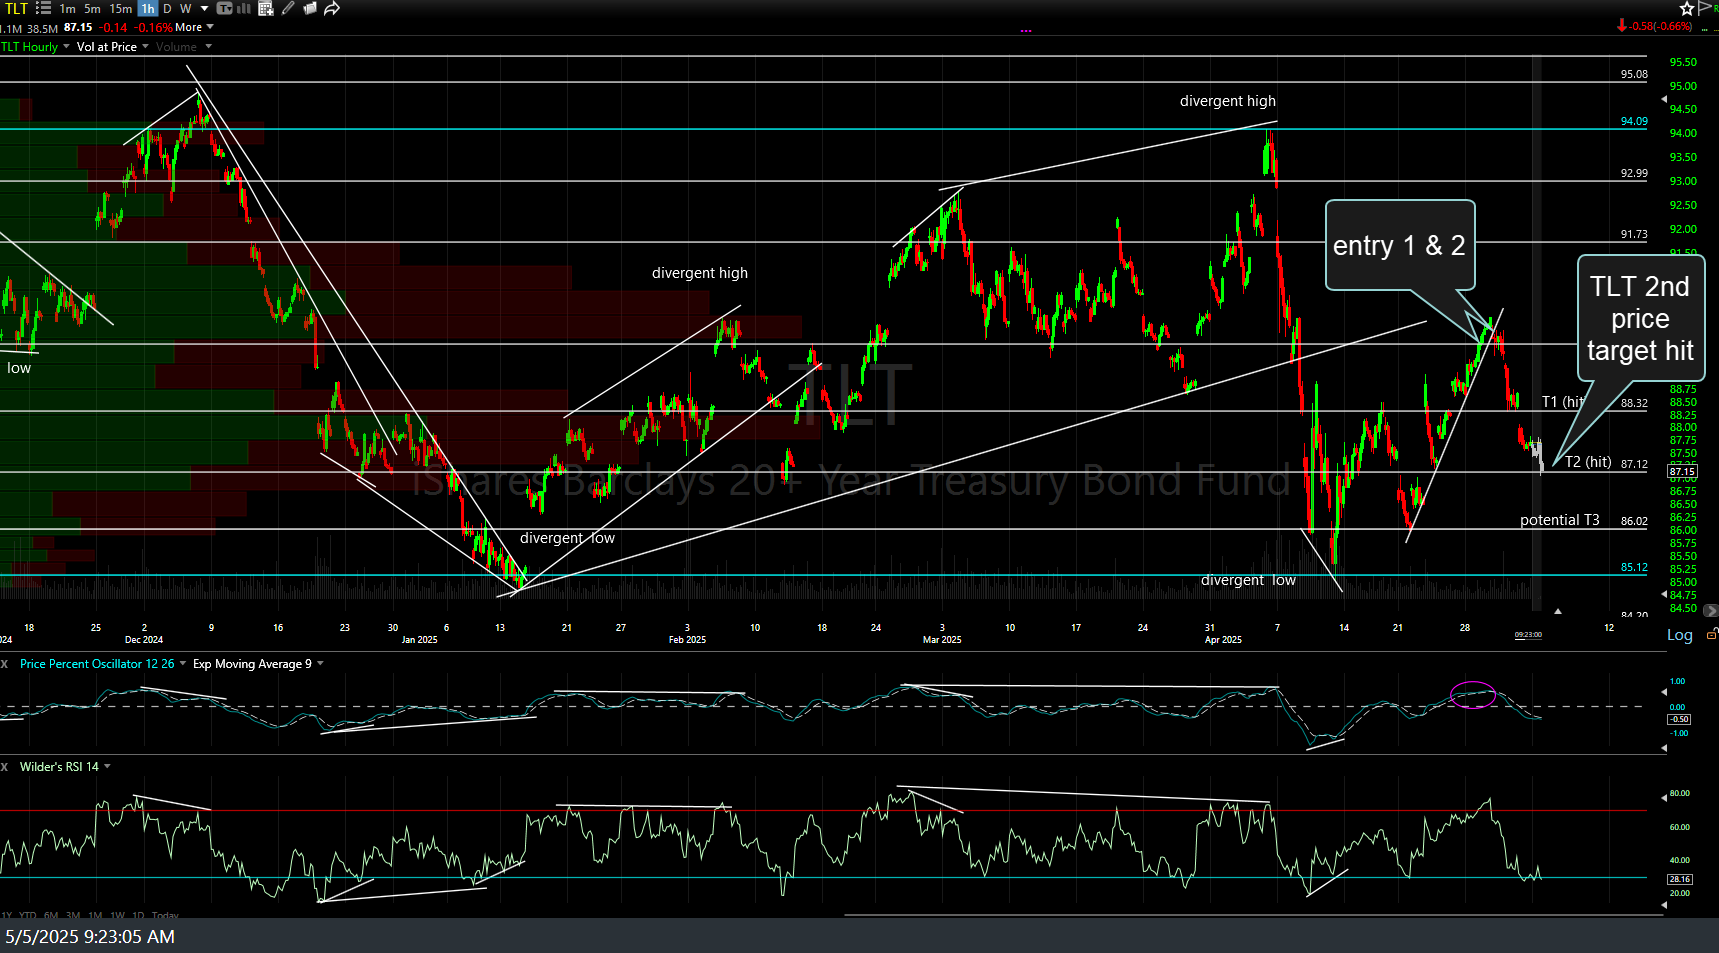
TLT 60m May 5th

TLT 60m May 13th
Zooming out to the daily chart to look at the bigger picture, as TLT just hit the potential 3rd & final swing target from the previous trade, I’m watching the 30-yr yield ($TYX) closely as a breakout above the Oct ’23 highs would take the 30-yr to yeilds not seen since the early 2000’s… almost certainly a major headwind for the stock market should that occur. Remember, it became crystal clear that the Fed had lost control of the yield curve when the 30-yr yield ROSE instead of fell after the previous 3 rate cuts last fall.
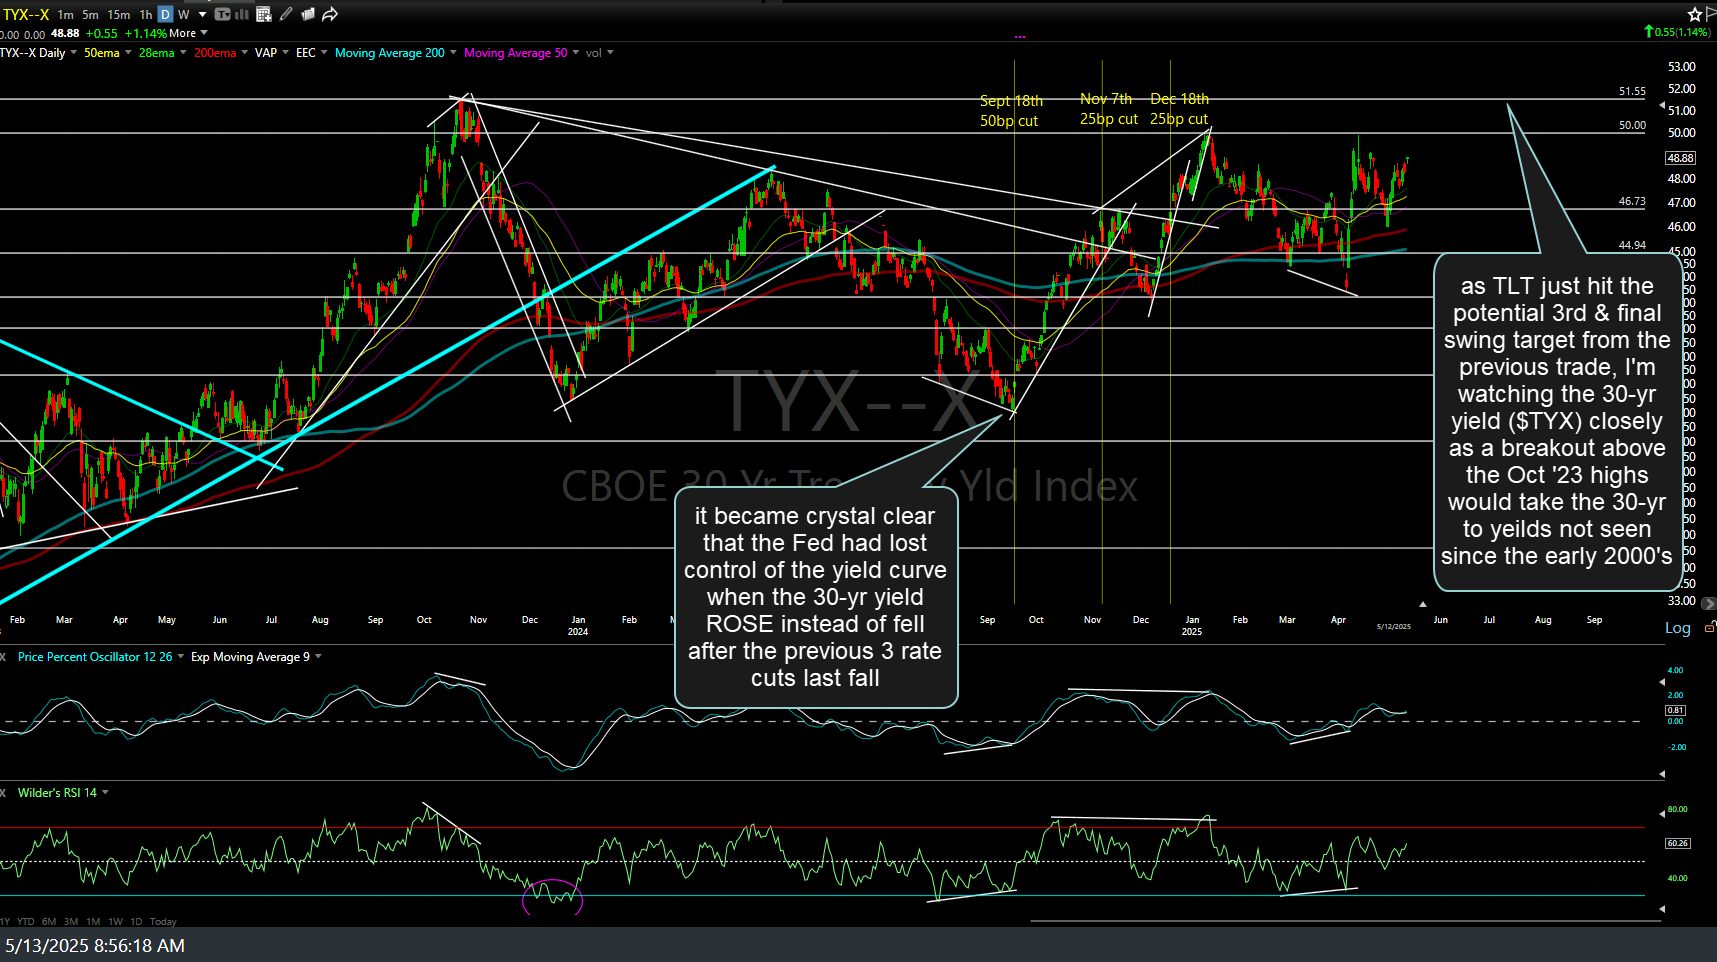
$TYX daily May 13th
While there are some potential divergences that could be the catalyst for a rally in TLT, I don’t have a strong opinion (nor position) on the near-term direction. Just something to monitor going forward, IMO.