
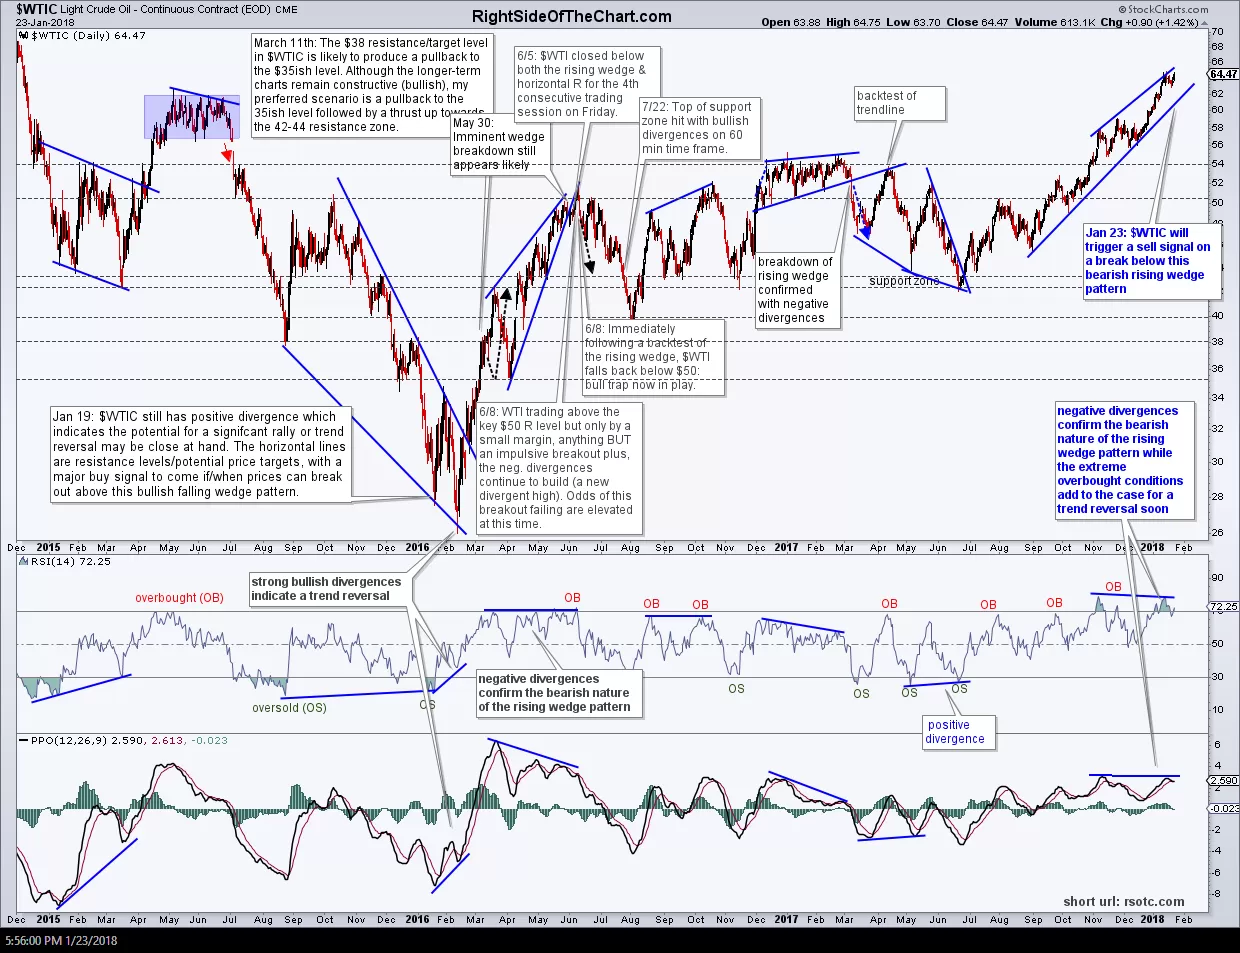
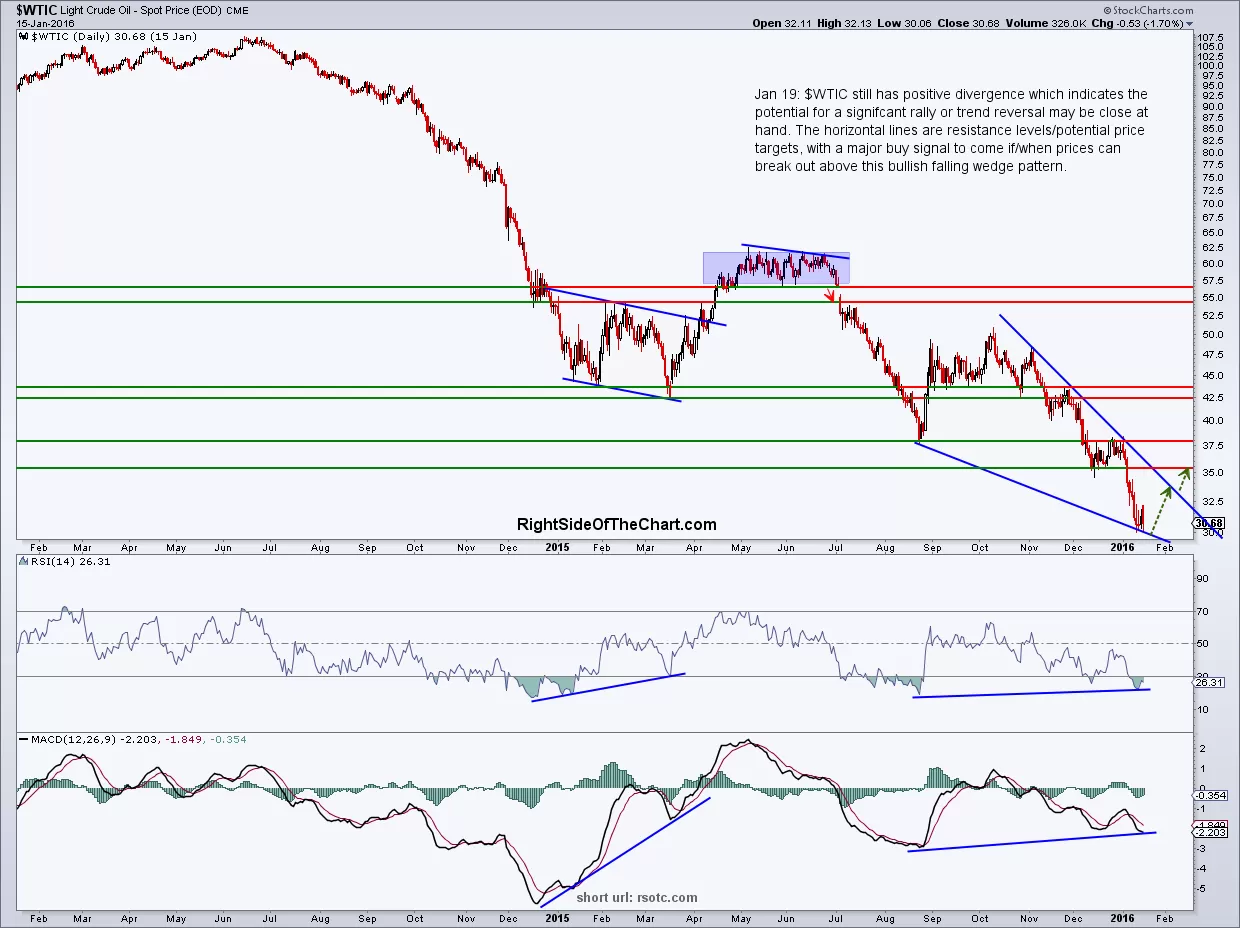
Technical evidence for a major trend reversal and correction in crude oil continues to build. The first chart below is the same chart (many annotations & technical developments later) that was posted here back on January 19, 2016, making the case that “a significant rally or trend reversal was close at hand” just 3 weeks before crude bottomed & embarked on the bull market that has so far seen $WTI rise by approximately 150%.
-

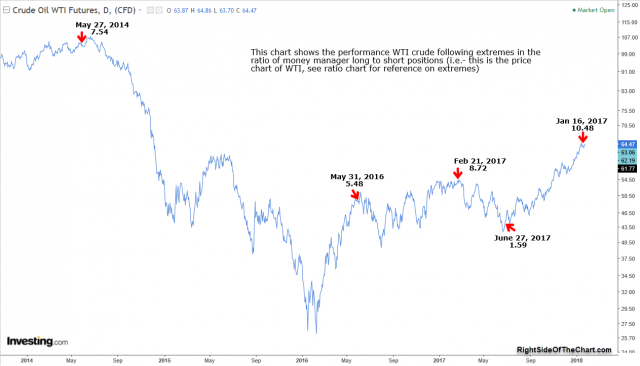
- $WTIC daily Jan 23rd
-

- $WTIC daily Jan 19, 2016`
Positive & negative divergences, rising & falling wedges, trendlines, breaks above/below resistance/support levels, overbought & oversold readings, etc.. all help to determine where prices might be headed but some of the most powerful trends are the result of lopsided trades, such as the current extreme bullish sentiment and more importantly, the extreme bullish positioning in crude oil.
I’ve always felt that one of the short-comings of using sentiment surveys as contrary indicators when they are at bullish or bearish extremes is that all they tell us is the surveyed participants thoughts as to the outlook (bullish or bearish) for a particular security, asset or index such as crude oil, the stock market, etc.. While arguably, one can assume that the current positioning of a fair number of those surveyed is in alignment with their bullish or bearish expectations, it would be reasonable to assume that some market participants that might be bullish or bearish on a particular security do not current hold a position. Maybe they are on the sidelines in cash, maybe bullish but waiting to buy in on a pullback or bearish but long the security in an aging uptrend with a trailing stop in place in order to let their winning position ride.
-
- WTI long-short ratios Jan 23rd
-
- WTI long-short ratio extremes
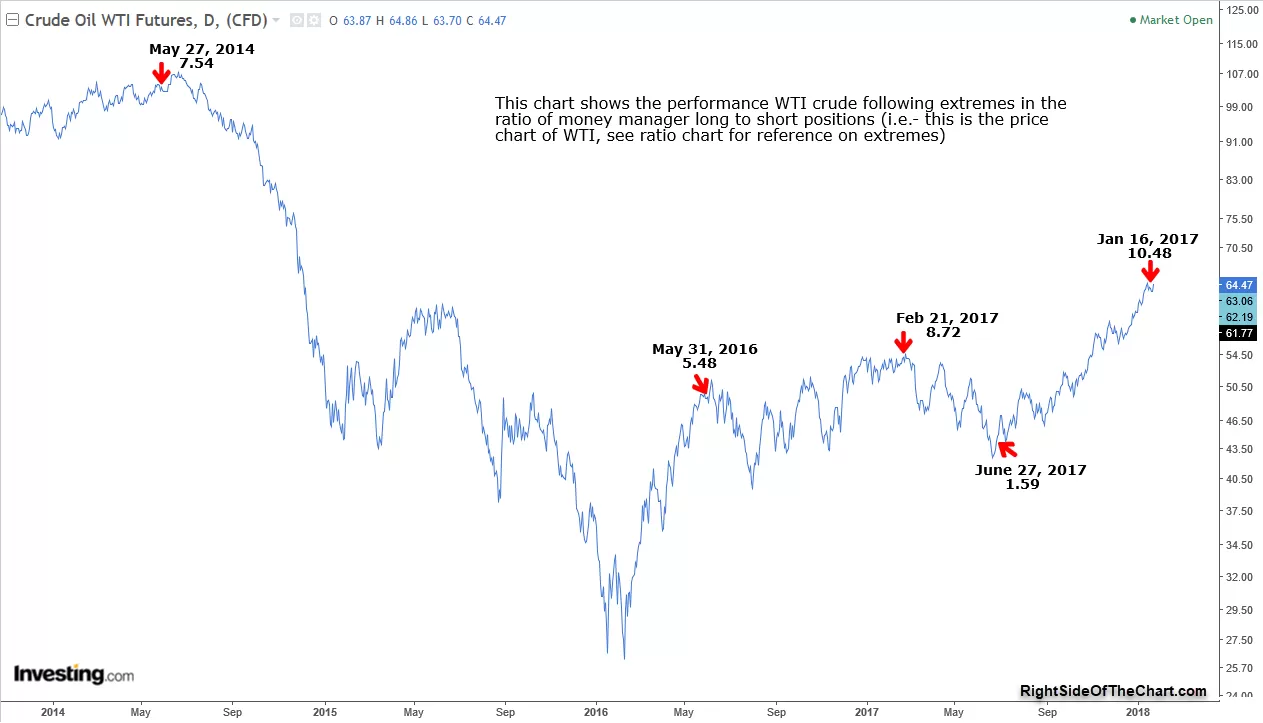
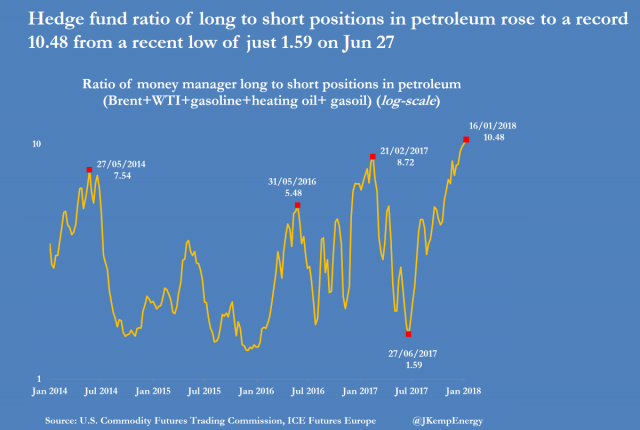
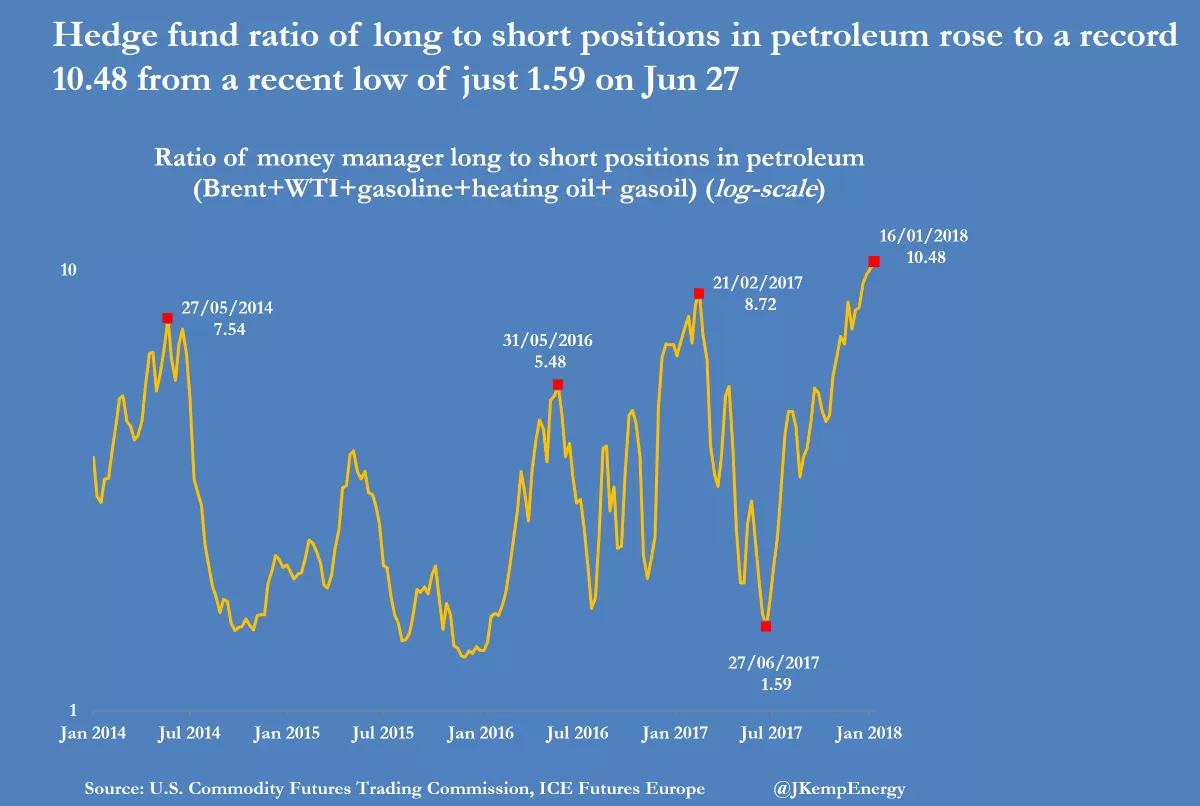
Actions speak much louder than words and as such, the charts above show us how the big players are positioned in crude. The first chart above is the hedge fund ratio of long to short positions in petroleum (Brent+WTI+gasoline+heating oil+gasoil). The most recent ratio of 10.48 is the highest in years (possibly ever?). On the following chart of $WTI, I plotted the dates of those extreme ratios in order to provide a visual on how those extremes marked major tops & bottoms in crude (note: the source of that first chart did not mark the Jan 2016 extreme lows or the early 2015 extreme lows but you can see that both of those extremes coincided with major bottoms in WTI.) The next chart is essentially that chart above flipped upside down, as it shows the total short positions in the petroleum complex for hedge funds. The extreme highs & lows on that chart also correlate with the major tops & bottoms of the WTI chart posted above.
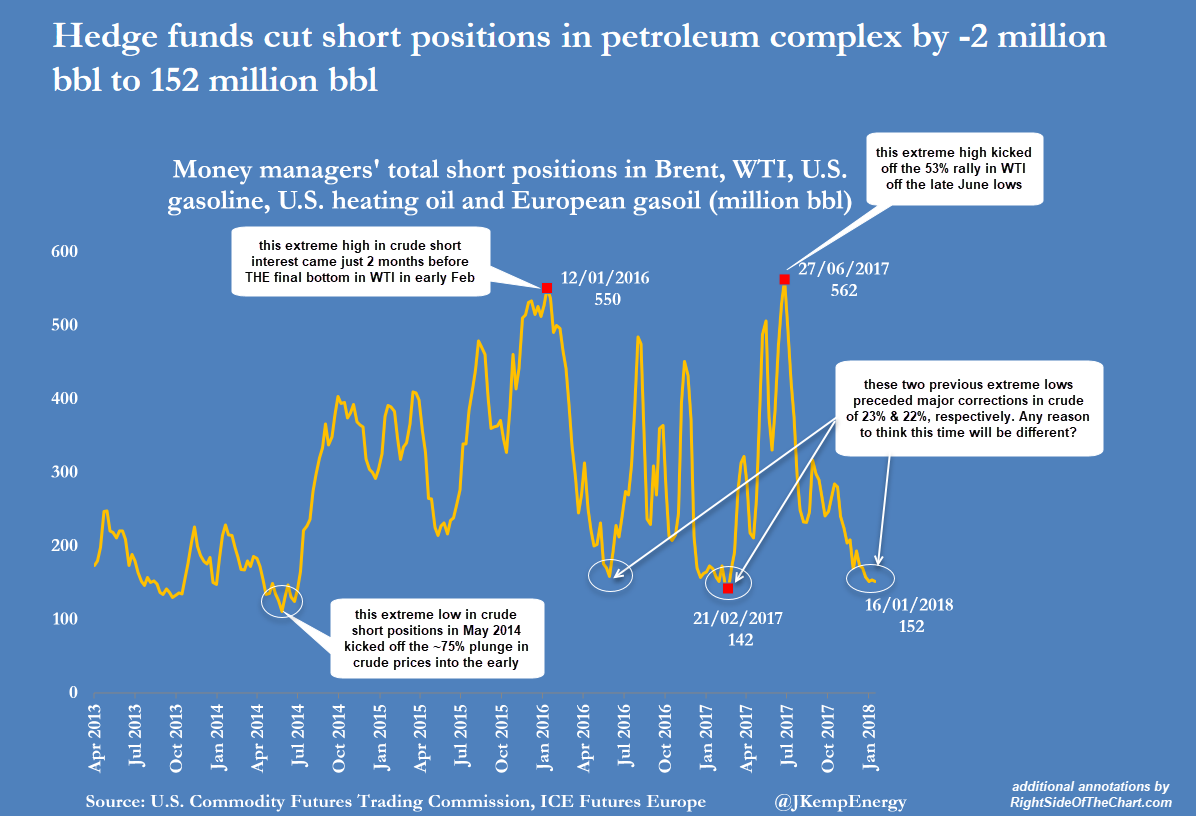
WTI hedge fund short interest Jan 23rd
Bottom line: Just as with the US equity market, the trend in crude oil is clearly bullish & very strong without anything remotely close to a sell signal at this time. However, collectively, the technical evidence above indicates that the current bullish trend in crude is most likely in its final stages and if history repeats, the unwinding of the current extreme lopsided trade on crude is likely to result in a substantial & potentially sharp correction with a rush for the exits once it become clear to most that the rally has ended. If so, that correction will almost certainly spill over to the overbought & overcrowded trade in the energy stocks & ETFs (XLE, XOP, XES, etc..) as well.