
A week ago today in the post titled OpEx Ramps: Will Next Week Be Different?, I published the first chart below highlighting the well-known pattern of stock market ramp-jobs on the week or so leading up to options expiration (OpEx) each month. The horizontal lines mark the 3rd Friday of each month (standard equity & index options expiration).

QQQ OpEx Market Ramps Nov 13th
While I was wrong on my hunch that Nov might be another outlier like we had in August, where they didn’t ramp the market higher on the week of OpEx, not only does that not dampen my expectations for a decent pullback very soon but as history shows, the OpEx ramps are nearly immediately faded just as often as they occur. I want to share my current though process which is the fact that I still believe the upside is very limited at this point before a decent reversal kicks in, which in no way has to do with confirmation bias, as it is simply a reflection of both my current read on the charts as well as playing the odds as per the patterns in this chart below. Although I did go against the odds last week (well, somewhat, as I did reduce short exposure on Friday while stating that I expected a bounce early in the week), the very fact that very reliable pattern of ramping the market higher into options expiration did indeed occur, only increases the likelihood that the same pattern of post-OpEx selloffs will also play out next week. In this updated chart of the QQQ, the black arrows show that the OpEx ramps are nearly immediately faded just as often as they occur.
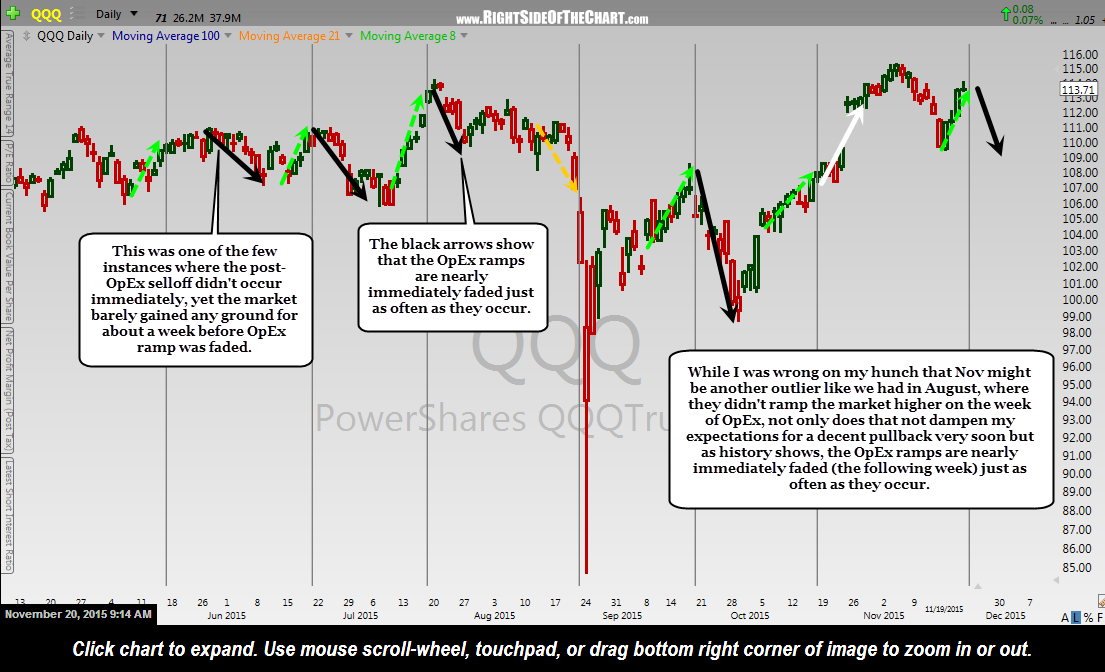
QQQ OpEx Market Ramps Nov 20th