
The index futures are currently indicating a mix open on the US equity markets with a fairly healthy gap up on the Nasdaq 100, a modest gap up on the S&P 500 & a modest gap down on the Russell 2000. The disparity between the large & small caps is due to the post-earnings rally in the 3 FAAMG stocks that reported last night. As quite often the initial reaction of a stock following earnings doesn’t prove to be the lasting reaction, here are the levels & potential technical developments that I’m watching for in the markets today.
SPY has the first decent resistance level just overhead around 256.60 & it is trading at 256.56 in the pre-market session as I type. If that level is taken out, the next level would be the highs at 257.51. The outlook for SPY still remains bearish heading into today & there are a couple of things that I’ll be watching for to further strengthen the case that the markets are in the early stages of a correction. Other than a failure to break & close above the aforementioned resistance levels, I’m awaiting a break & 60-minute close below this price channel as well as the 253.87 support level for the next sell signal on SPY & a move down to the 250.26 level. I’ll also be watching to see if trend indicators remains bearish at the close today.
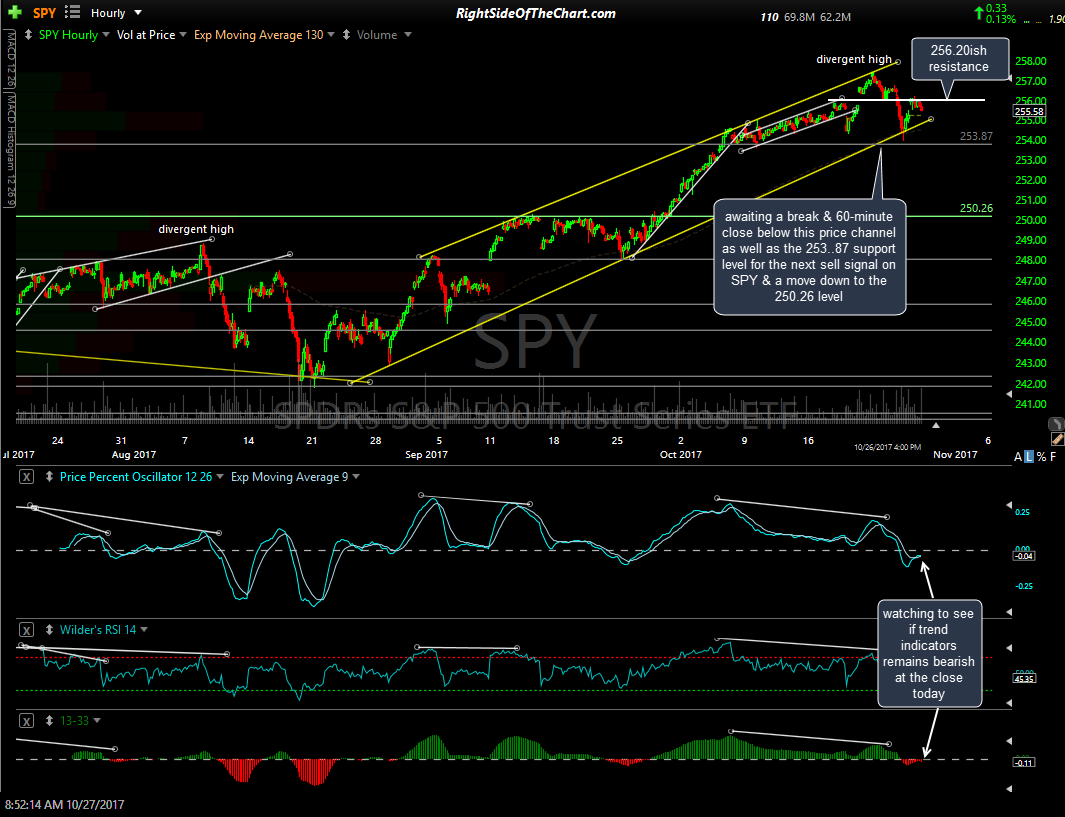
SPY 60-min Oct 26th close
The Nasdaq 100 will be stretching the limits on the bearish case today although keep in mind that not only is it one of several major U.S. stock indices, but it is also the least diversified of any major US stock index, lacking certain key sector exposure, very over-weighted in technology & very heavily over-weighted to just a handful of top components. Essentially, the charts of QQQ nearly perfectly mirror that of XLK, the technology sector ETF. With that being said, technology also comprises the largest sector weighting within the S&P 500 so the importance of the technology sector can not be ignored.
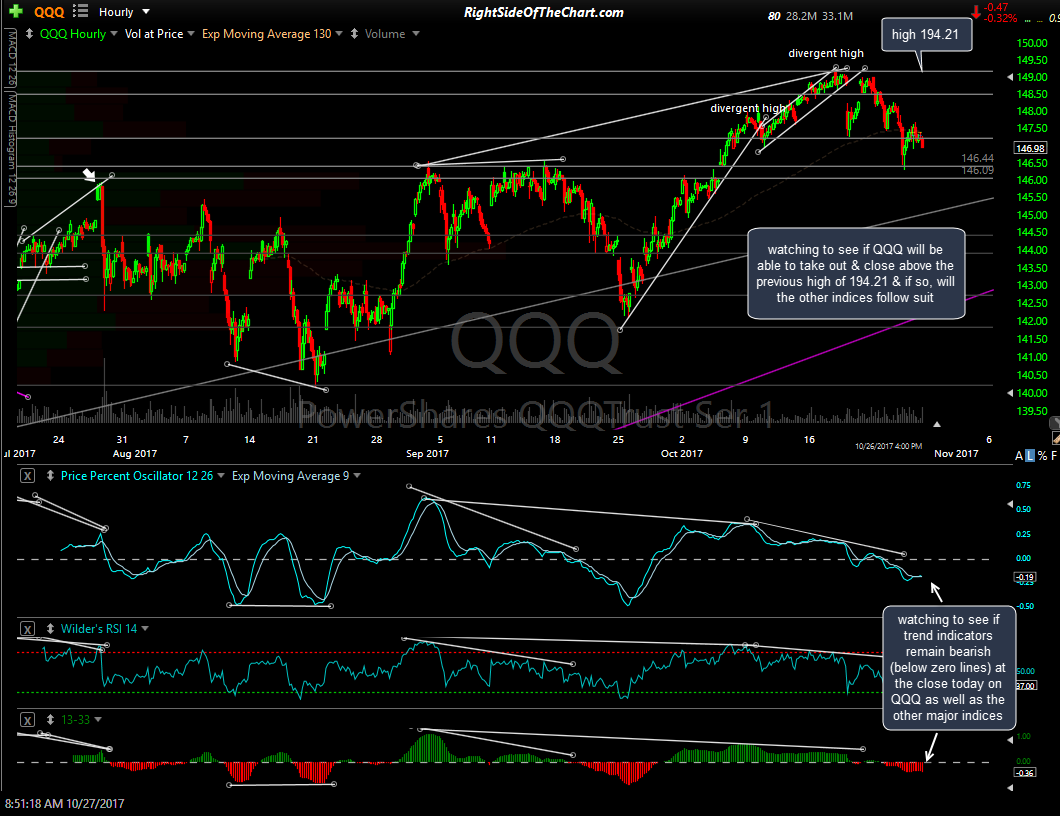
QQQ 60-min Oct 26th close
The previous high on QQQ was 194.21 so I’ll be watching to see if the Q’s can close above that level today & hold above it next week. If so, the other indexes will need to follow suit to also take out their previous highs in order to confirm a healthy advance & resumption of the uptrend. I’ll also be watching the 60-minute trend indicators on QQQ which are currently bearish (13/33-ema pair histogram & the PPO signal line, both bearish when below their zero lines).
On the small caps, IWM has a previous high of 150.68 about 1.3% below where it close yesterday. Also watching to see if the trend indicators remain bearish or cross back to bullish in the coming sessions. Note: All charts reflect prices as of yesterday’s close.
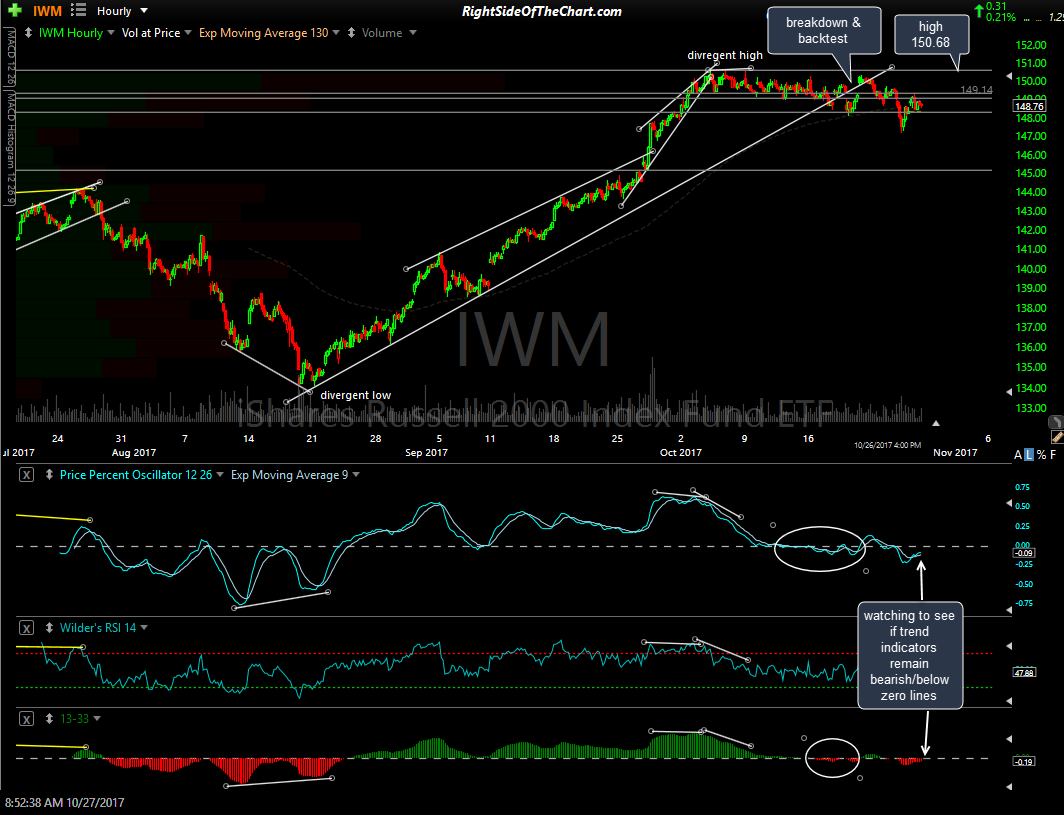
IWM 60-min Oct 26th close