
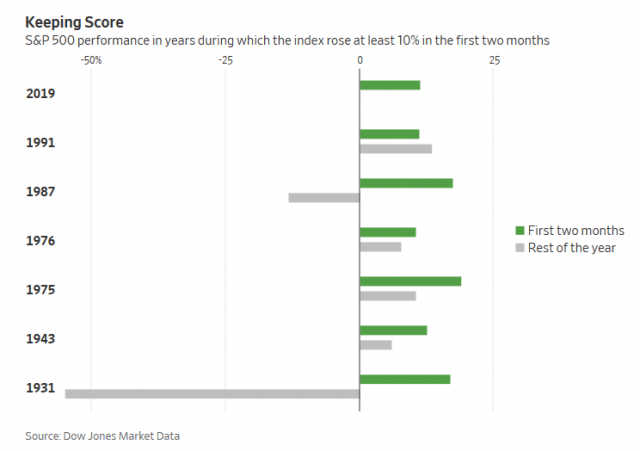
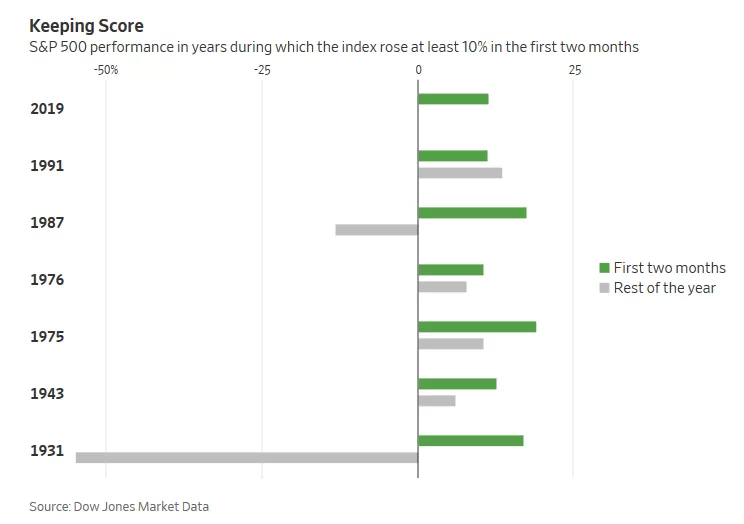
This video starts with an update on the US stock market via technical analysis followed by fundamental analysis of the US economy via various economic indicators. Around the middle of the video, I also do a comparison/analysis of the 6 previous periods where the stock market rose at least 10% in the first two months of the year, with the Jan-Feb rally in 2019 only the 7th time the stock market has experienced such a strong start to the year.
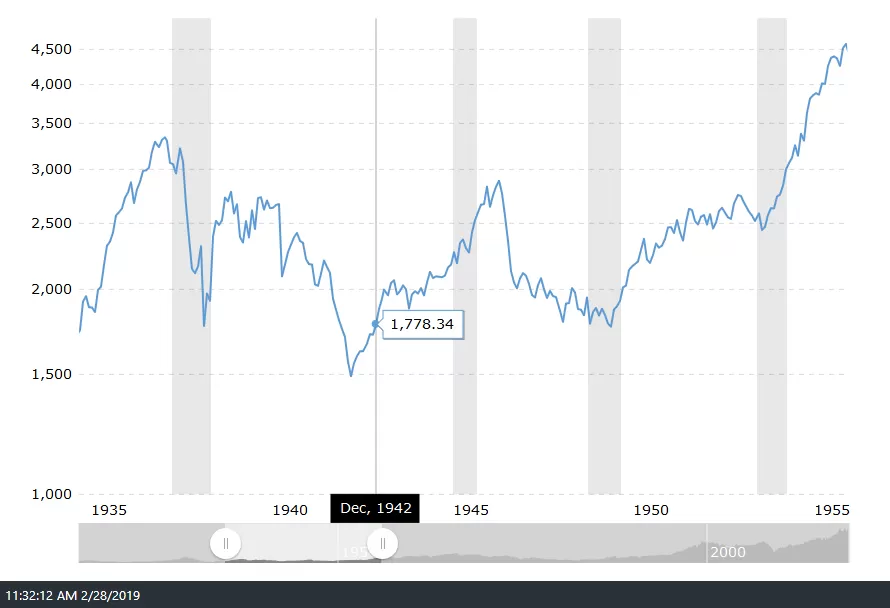
For reference, I have posted some of those charts below. Also worth noting (and not mentioned in the video) is the fact that the of the 6 previous times when the S&P 500 started the first two months of the year with a gain of at least 10%, as per the chart referenced in the video, the market ended up building on those gains into the end of the year 4 out of the 6 times whereas the Dow Jones Industrials closed the year below its February close in 1976, thereby resulting in 50/50 split of the market either building on the Jan-Feb rally or fading it by year-end.
playback speed can be increased in the settings to reduce video duration
(click in the first or any chart below to expand)
-
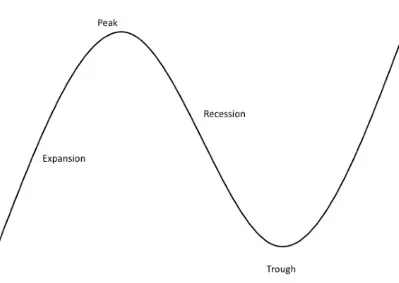
- economic business cycle
-

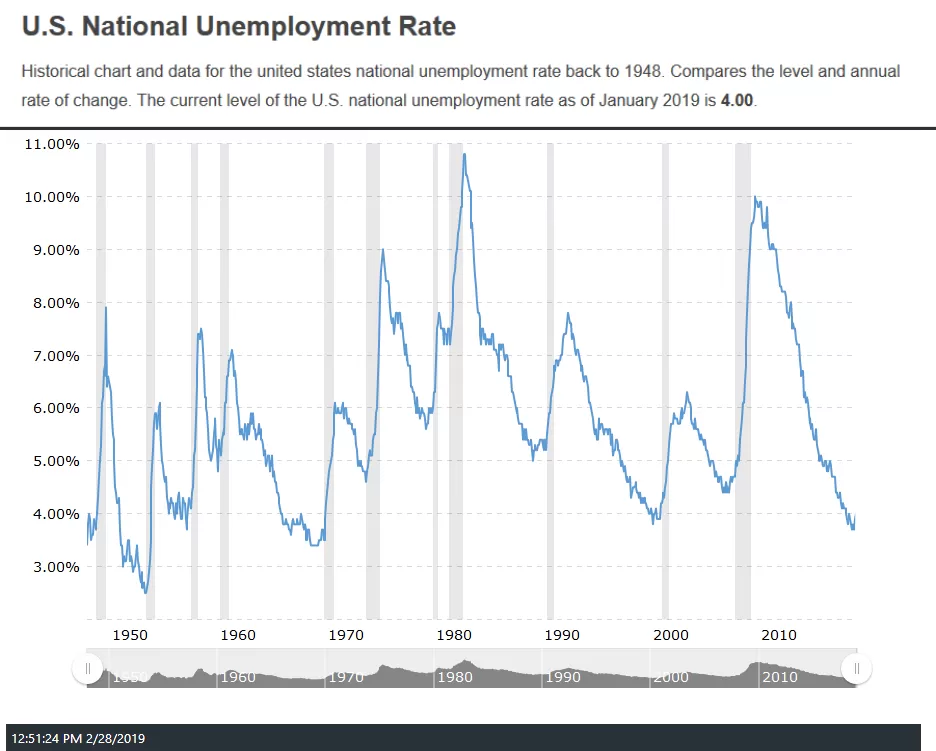
- National Unemployment Rate 2-28-19
-

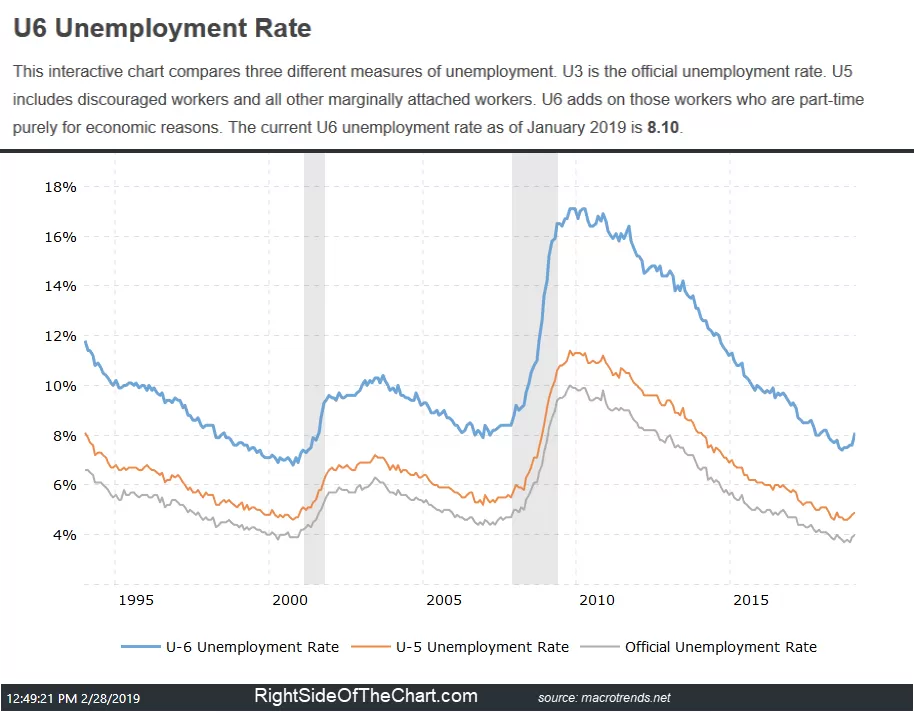
- U6 Unemployment Rate 2-28-19
-
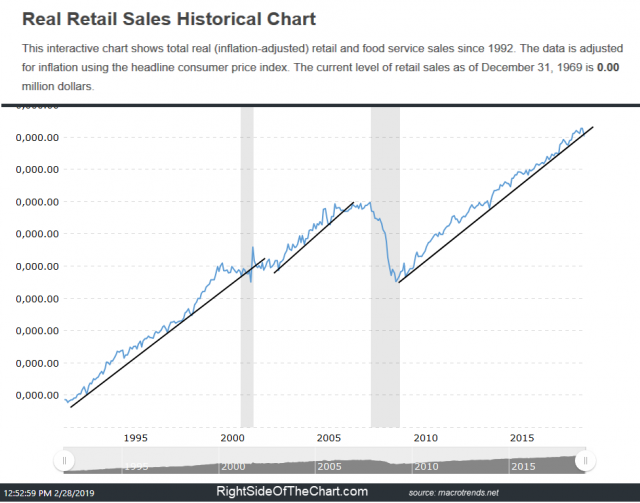
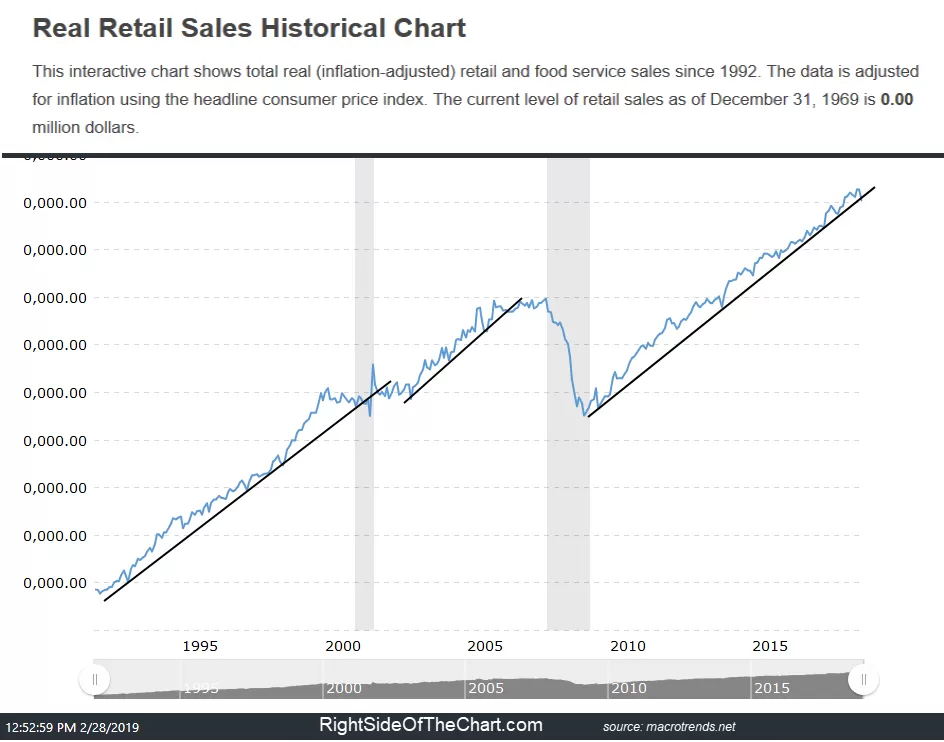
- Retail Sales Feb 2-28-19
-
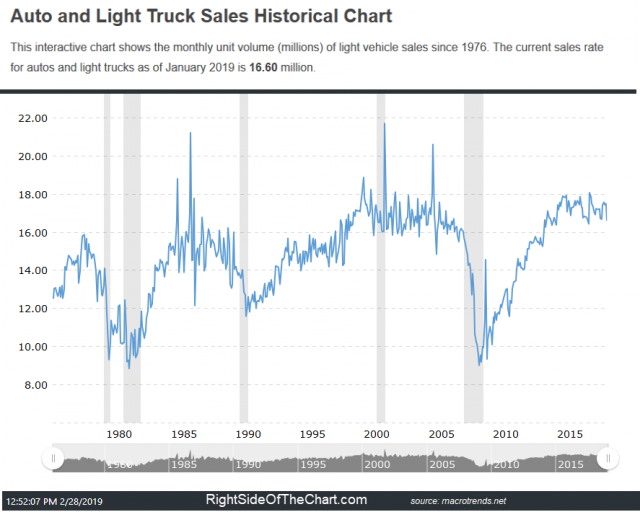
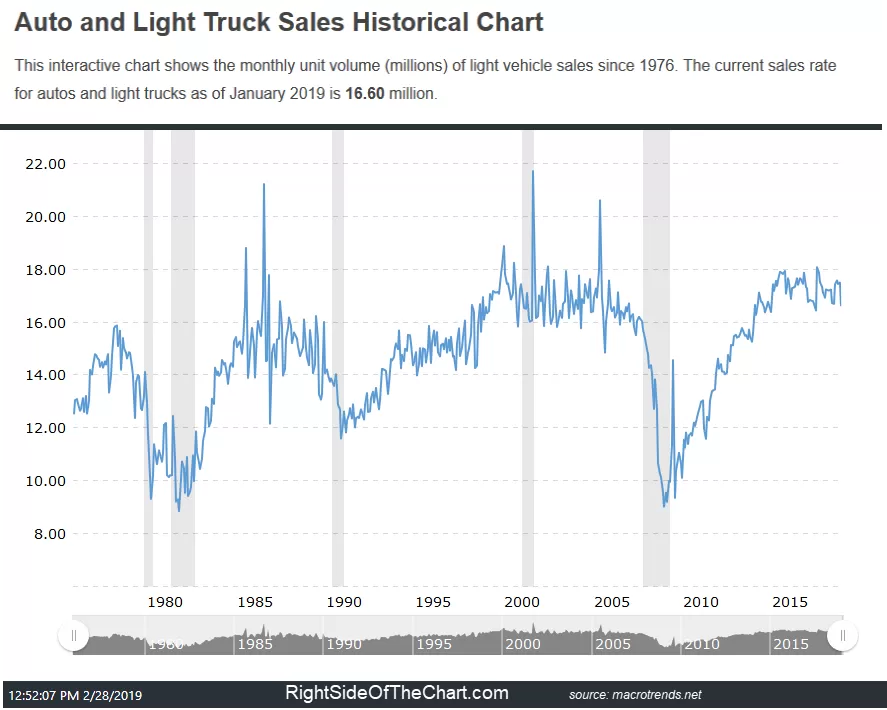
- Auto Light Truck Sales 2-28-19
-
- SPX 10pc Rise in Jan-Feb
-

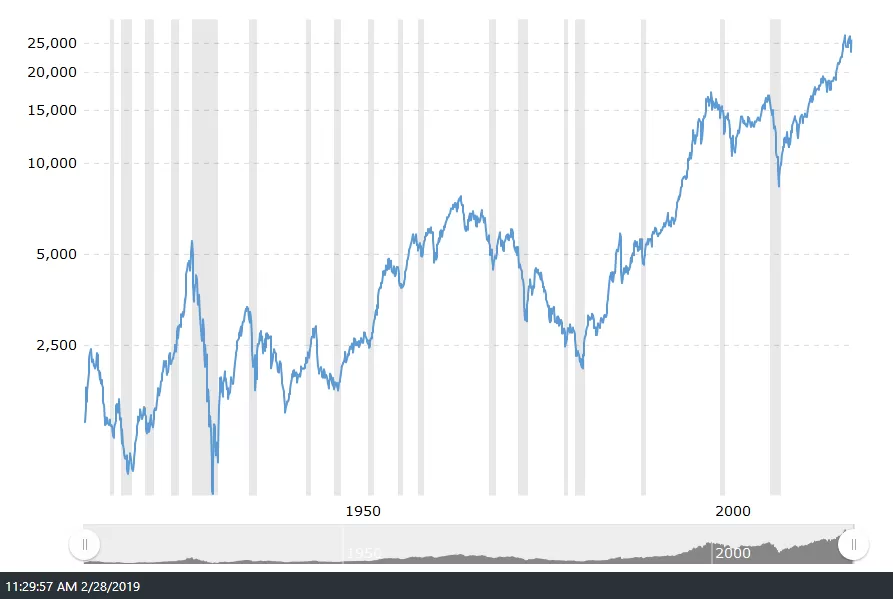
- 100 yr DJIA chart
-
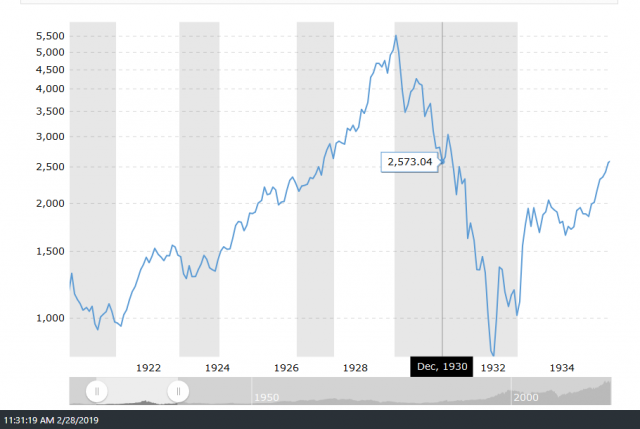
- 1931

-
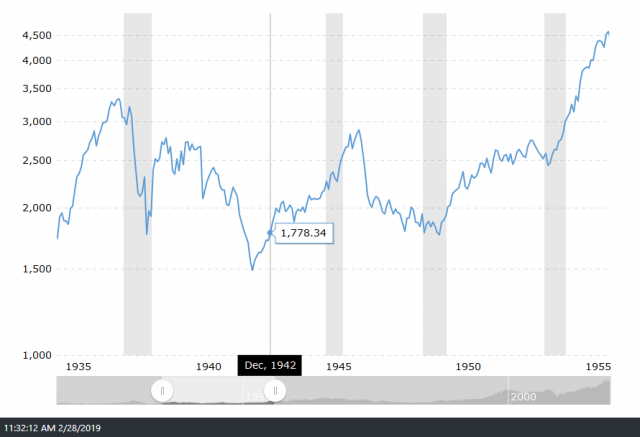
- 1943
-
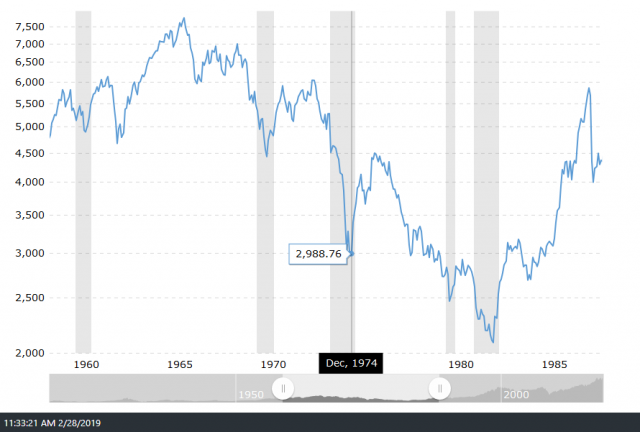
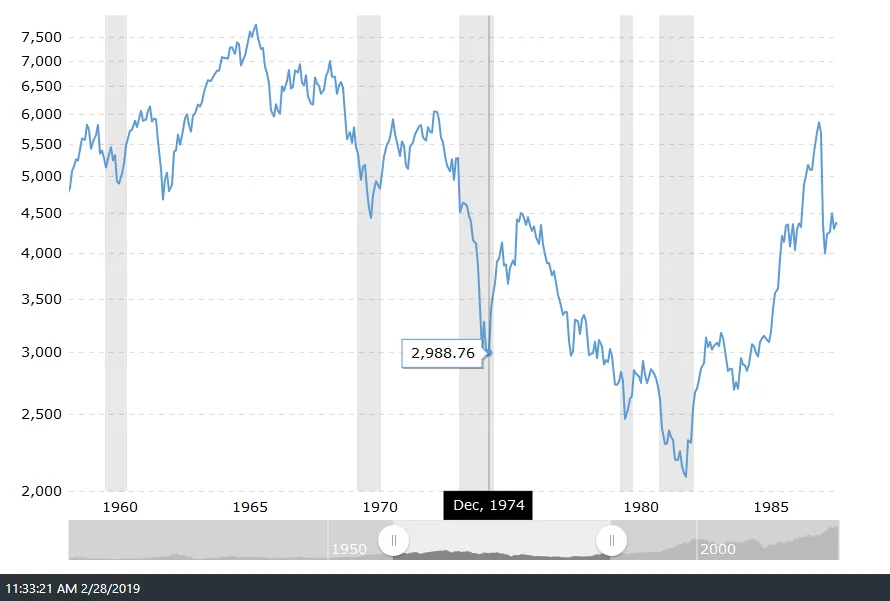
- 1975
-
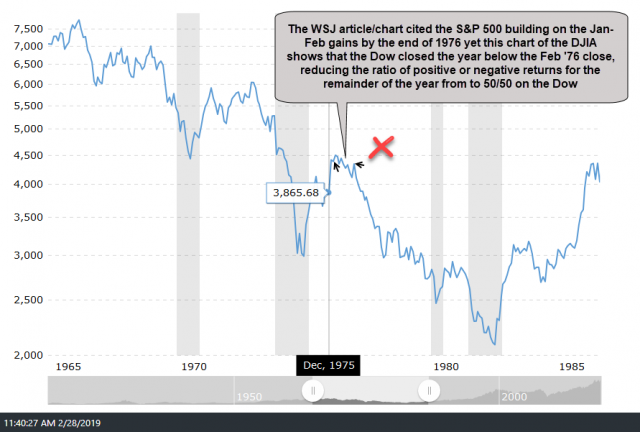
- 1976

-
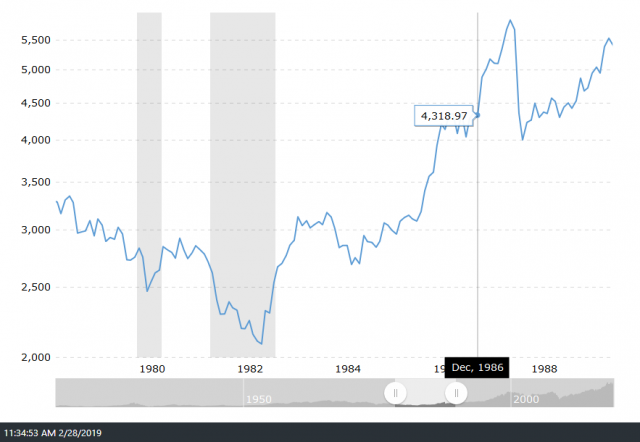
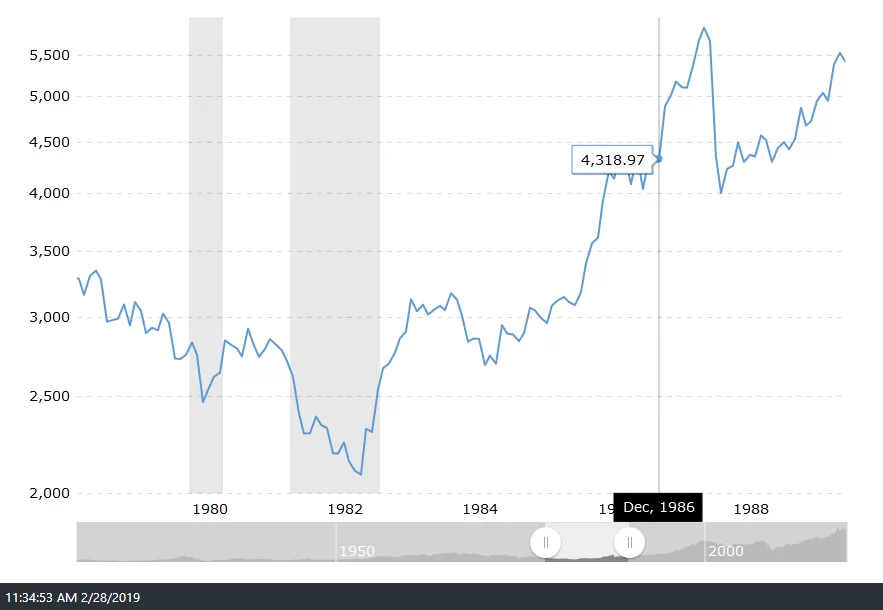
- 1987
-
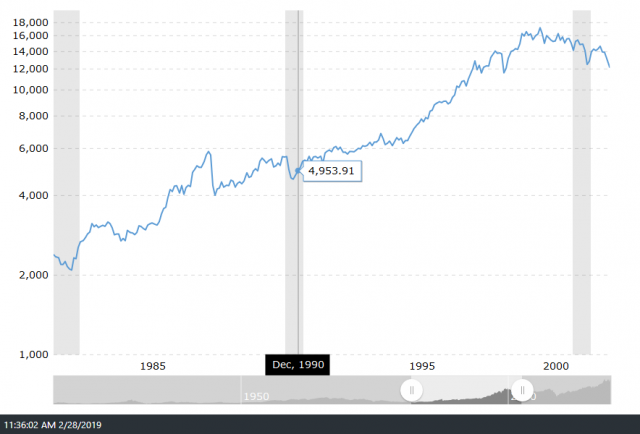
- 1991
