
We currently have technical cross-currents on the major stock index futures. /ES (S&P 500) formed a textbook-looking bull flag continuation pattern in the overnight session followed by an impulsive breakout above a bull flag pattern.
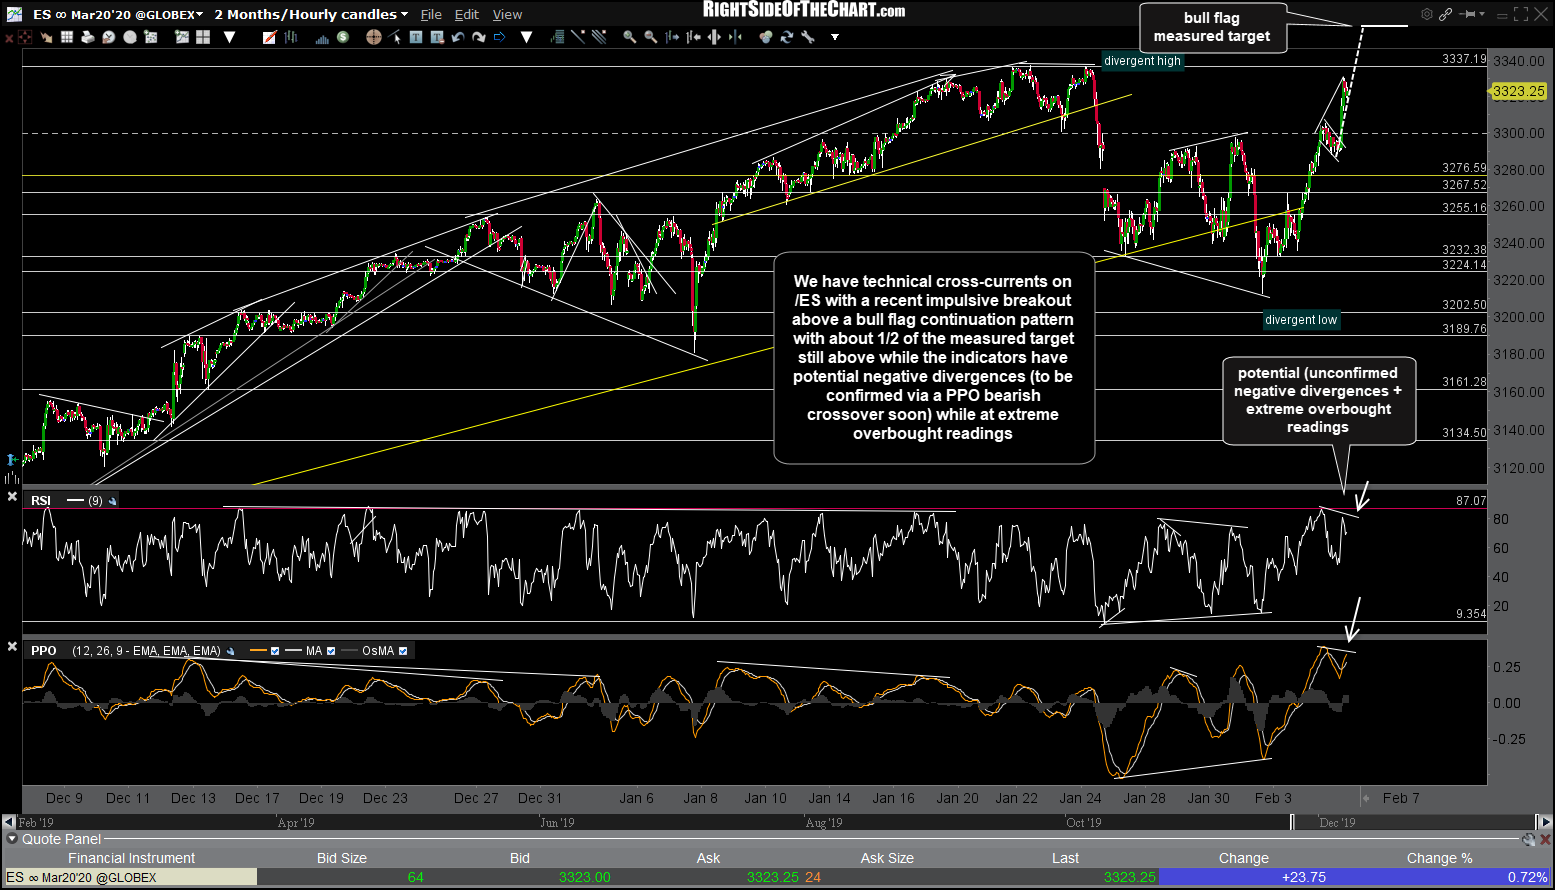
ES 60m Feb 5th
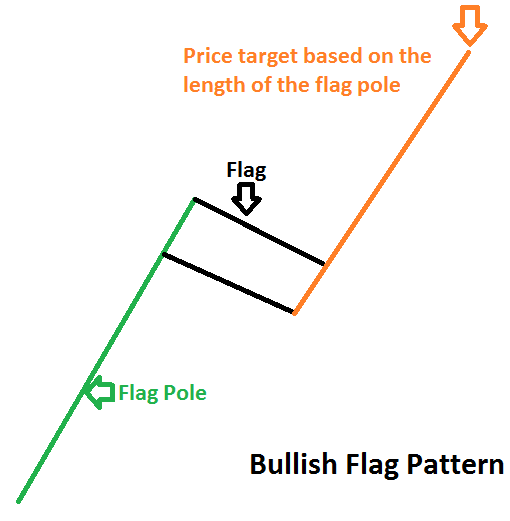
A bull flag is a bullish continuation pattern consisting of three parts:
- The ‘flagpole’, which is an impulsive, mostly uni-direction leg up (rally) followed by…
- A period of consolidation on decreased volume that takes the form of a flag (or pennant) followed by…
- An impulsive breakout above the flag with another very impulsive rally that roughly mirrors the flagpole. The measured target for a bull flag or its close cousin, the bullish pennant continuation pattern, is the length of the flagpole added to the lowest point of the flag (or pennant) just before the breakout.

Bull Flag Pattern
We also have virtually identical technical cross-currents on /NQ (Nasdaq 100) with a recent impulsive breakout above a bullish pennant continuation pattern with about 2/3rds of the measured target still above while the indicators have potential negative divergences (to be confirmed via a PPO bearish crossover soon) while at extreme overbought readings. As with yesterday’s breakout above the key 222.87ish resistance level on QQQ, these breakouts should be taken on face value until & unless they fail. As the rally following the breakout of bull flags & pennant continuation patterns should ideally mirror the rally leading up to the flag/pennant formations, any substantial pullback today that brings /ES & /NQ back down to & especially below those flags would indicate a false breakout.
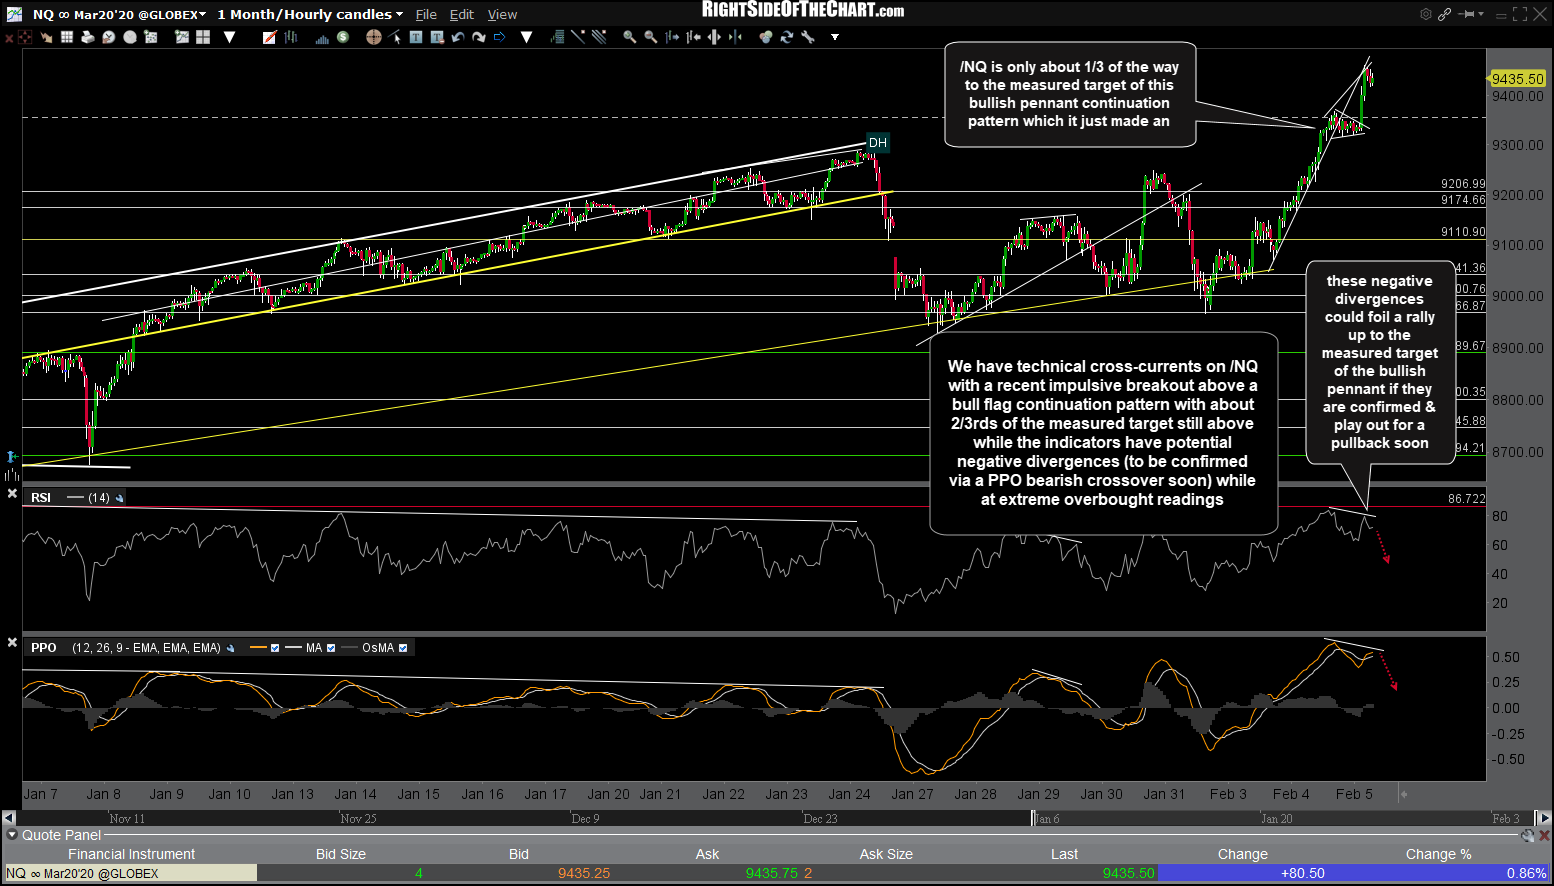
NQ 60m Feb 5th
Remember, the day is still very young with about an hour to go before the regular trading session opens. I’m still watching to see how SPY handles that 329ish resistance level on a daily closing basis; bullish if it can take it out with conviction & especially on a solid daily close above, potentially bearish if rejected off that level once again today although QQQ would have to make a solid drop back down below both the 222.87ish support as well as the uptrend line off the Oct 3rd low just below before triggering the next sell signal & objective short entry.
Updates on crude oil, natural gas & some of the other recent trade ideas to follow soon.