
With all five of the market-leading FAAMG stocks reporting over the next 5 trading sessions, starting with MSFT & FB after the market close today, I figured this would be a good time to share my analysis via the daily & weekly charts on each.
As a near-tie with AAPL on the world’s largest publicly traded company & a top component of the Nasdaq 100 as well as the S&P 500, let’s start with MSFT. The divergences that sparked the ~19% drop in Q4 have only grown larger on this recent advance in MSFT, indicating a good chance that the Dec lows, at minimum, will be tested once more in the coming months (weekly chart).

MSFT weekly April 24th
However, the uptrend off the Dec 24th low on Microsoft is solidly intact at this time while the divergences on both this daily chart & the weekly chart indicate an impending trend change is likely with a sell signal to come on a solid break & close below the trendline (daily chart).

MSFT daily April 24th
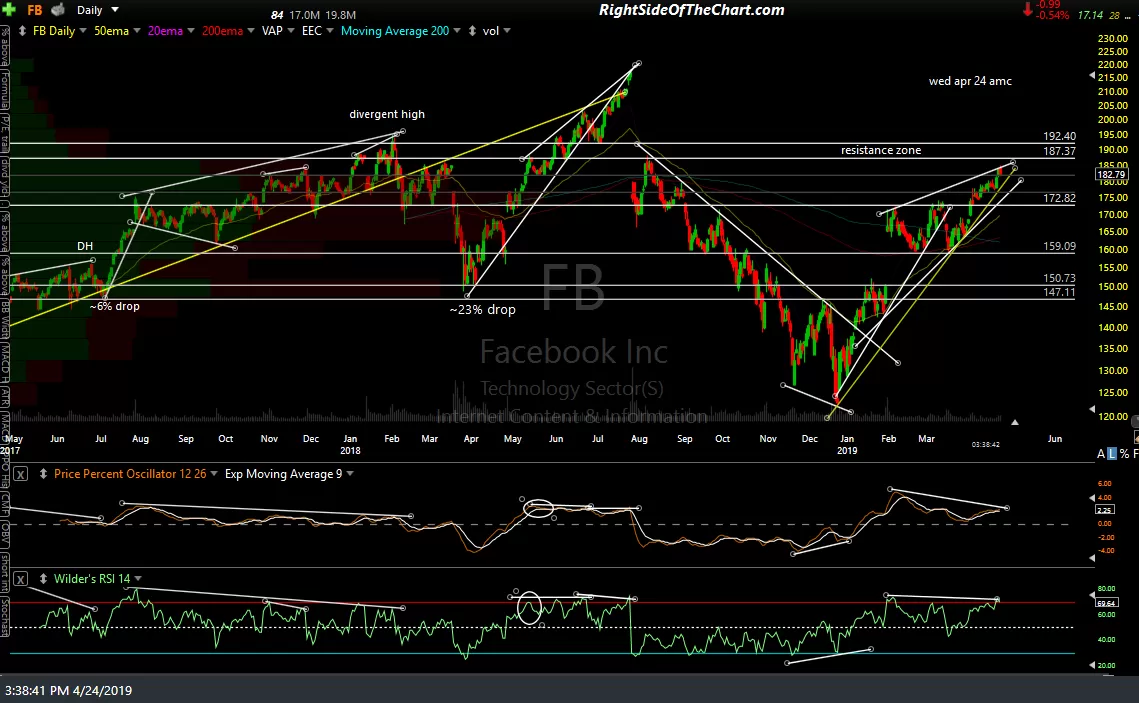
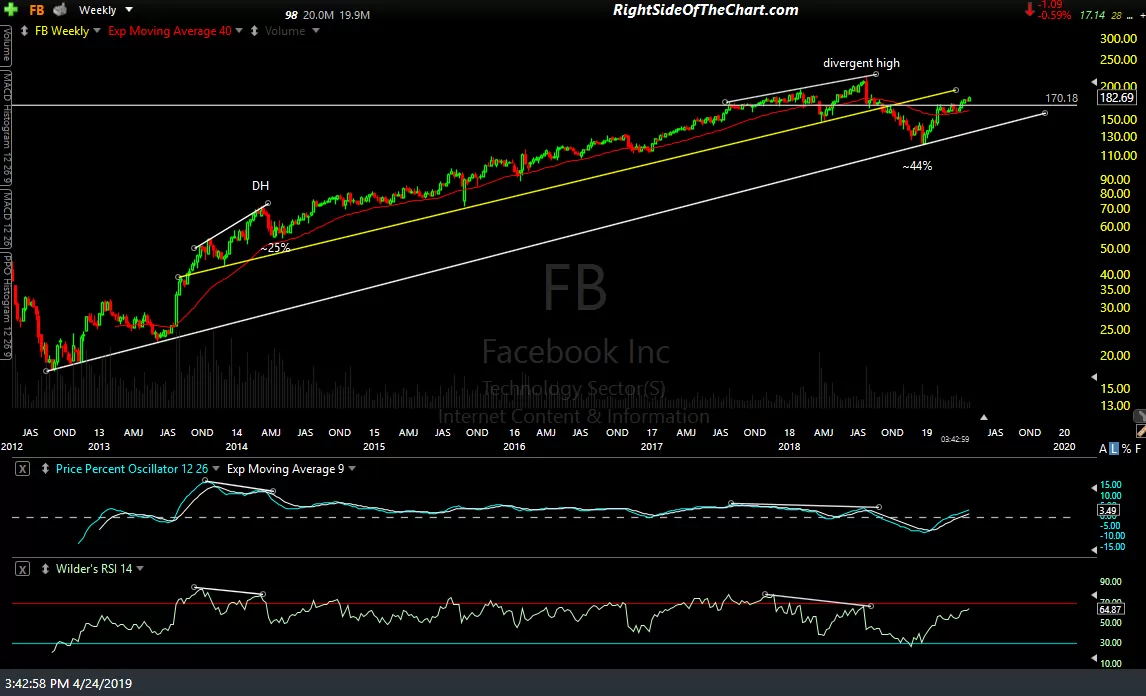
Also reporting tonight is FB (Facebook) which has been working its way up within this bearish rising wedge pattern with divergences building between price & the momentum indicators (daily chart followed by the weekly chart):
-

- FB daily April 24th
-
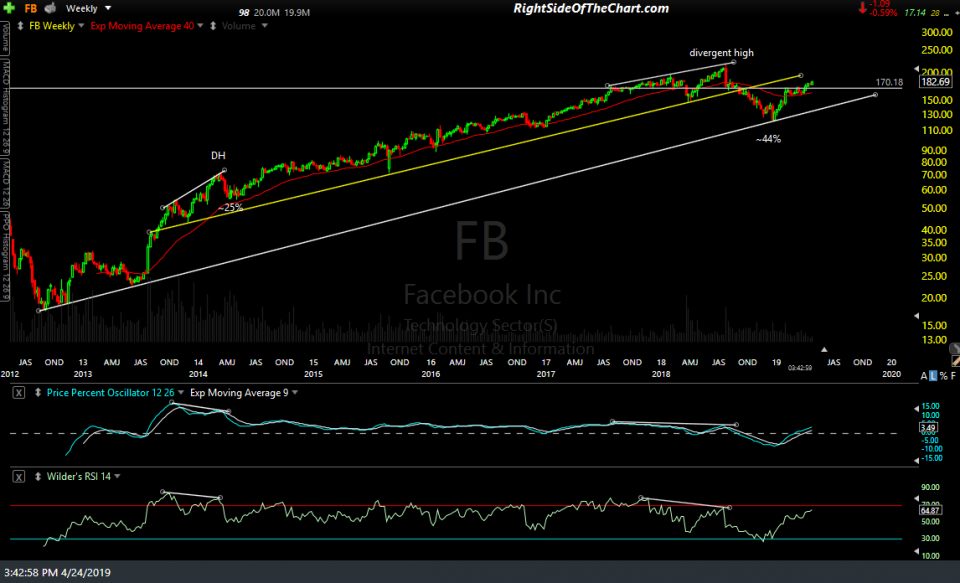
- FB weekly April 24th
Tomorrow brings earnings reports from both AMZN (Amazon.com) and GOOG/GOOGL (Alphabet Inc.). Same story as with the other FAAMG stocks: Awaiting an impulsive break below this trend line for a sell signal on AMZN while the trend remains bullish for now (daily chart).
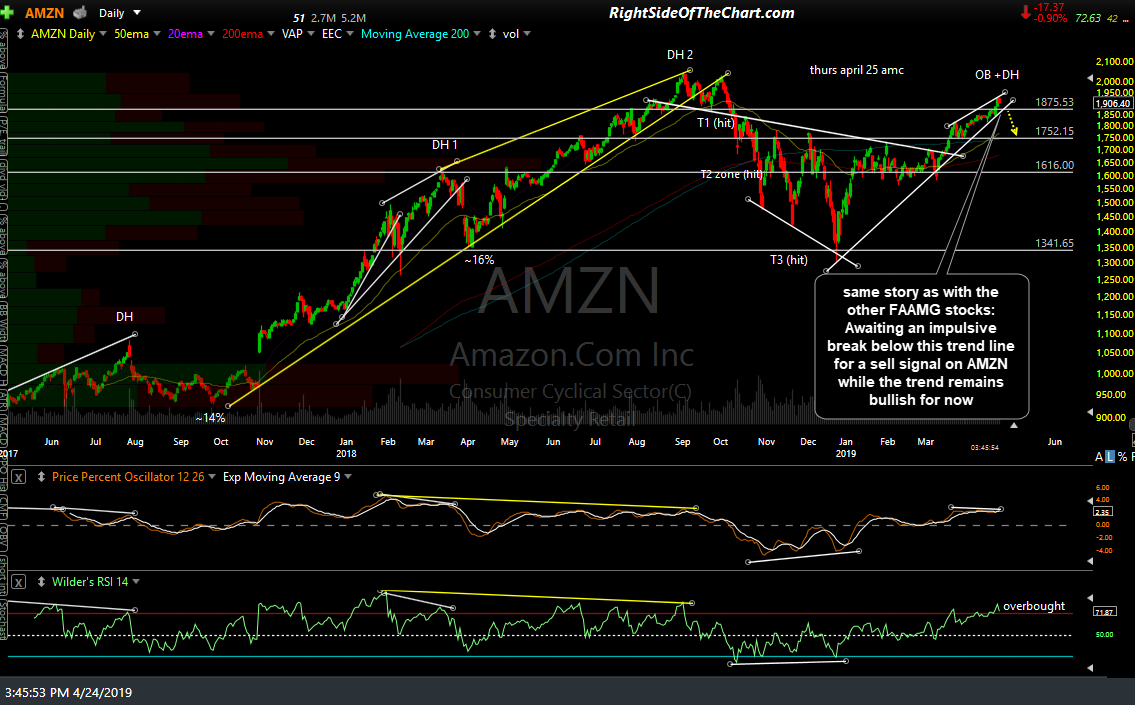
AMZN daily April 24th
While on the weekly chart, AMZN is currently backtesting the 4½ year uptrend line from below following the breakdown in Q4 2018.
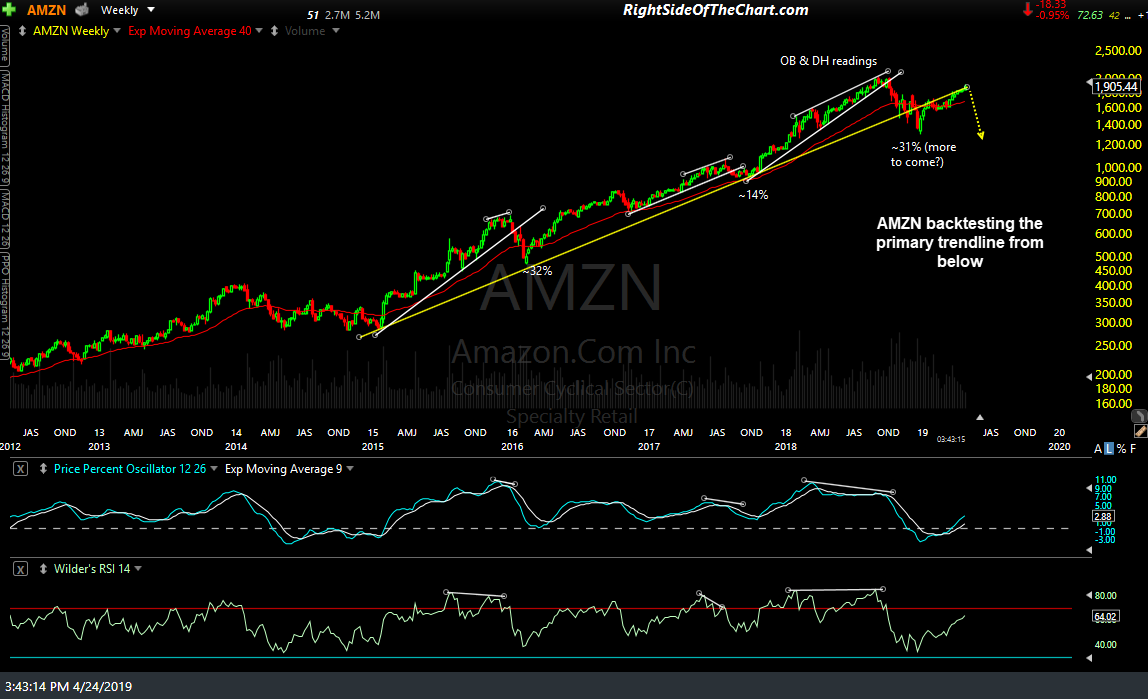
AMZN weekly April 24th
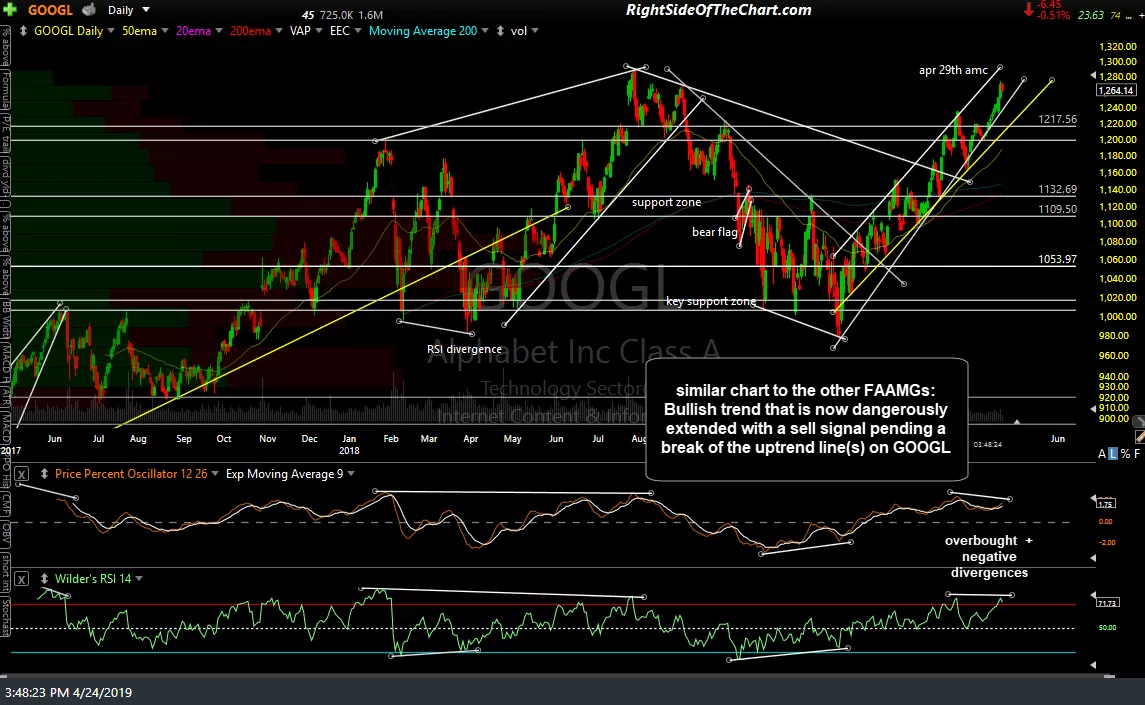
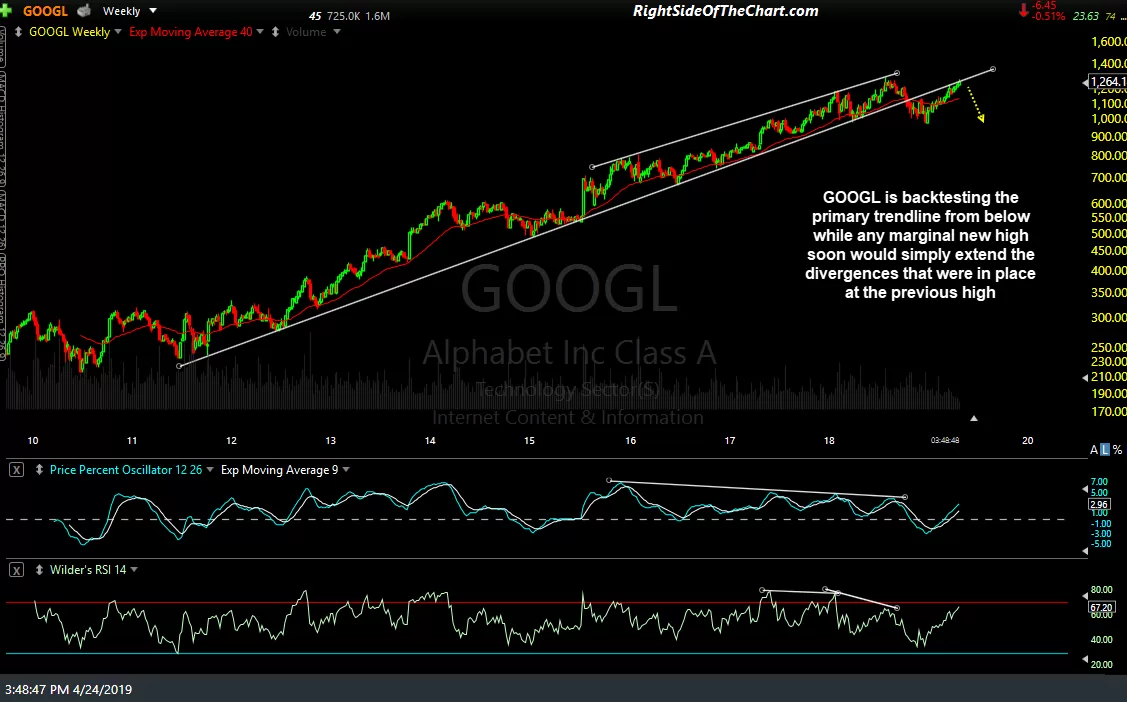
Basically a similar chart to the other FAAMGs with GOOGL: Bullish trend that is now dangerously extended with a sell signal pending a break of the uptrend line(s) with GOOGL also backtest the primary, multi-year uptrend line from below on the weekly chart.
-
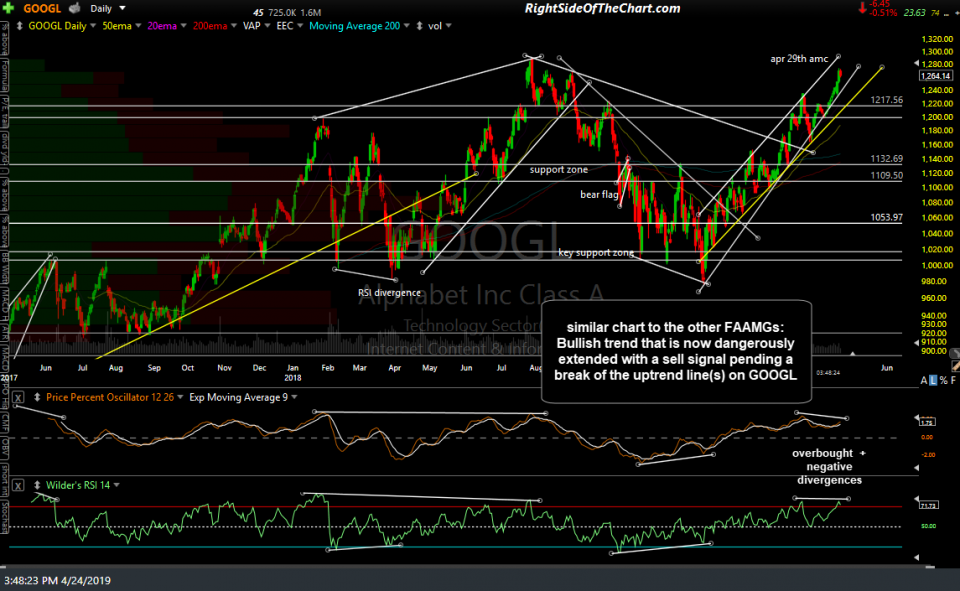
- GOOGL daily April 24th
-
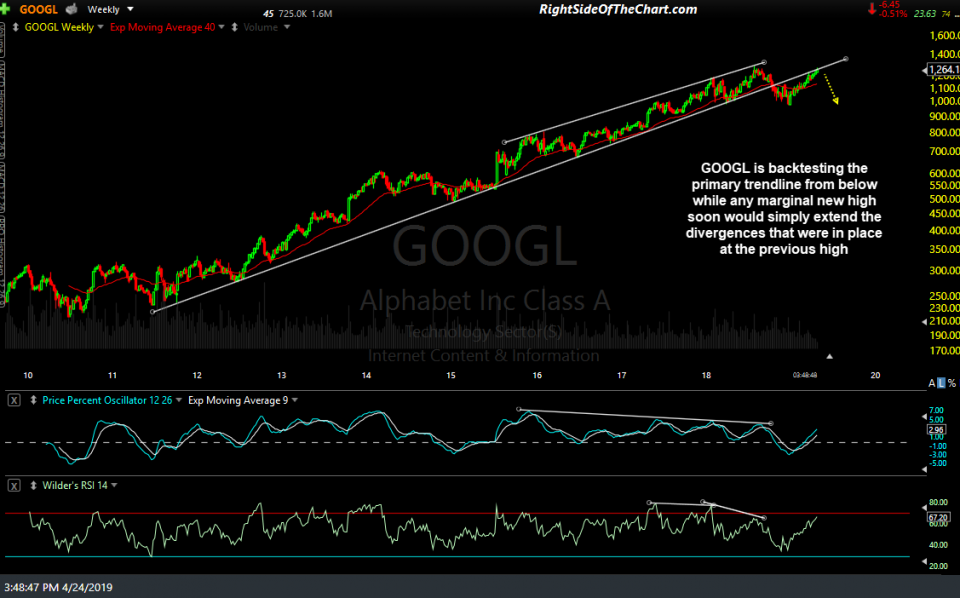
- GOOGL weekly April 24th
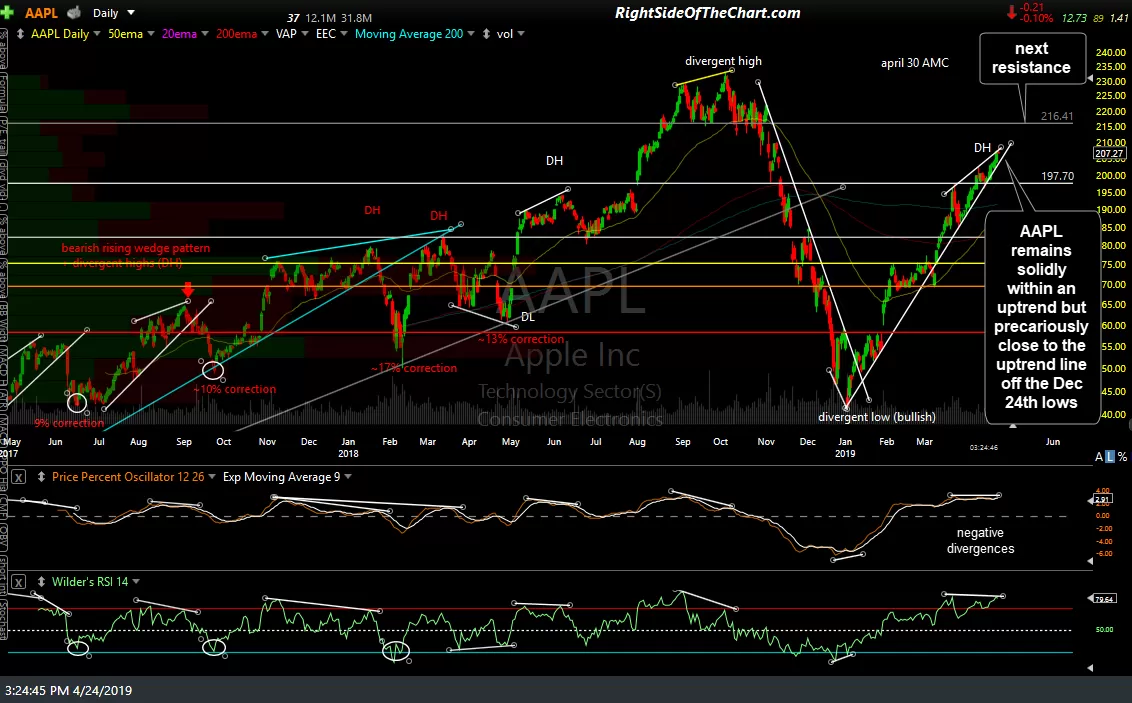
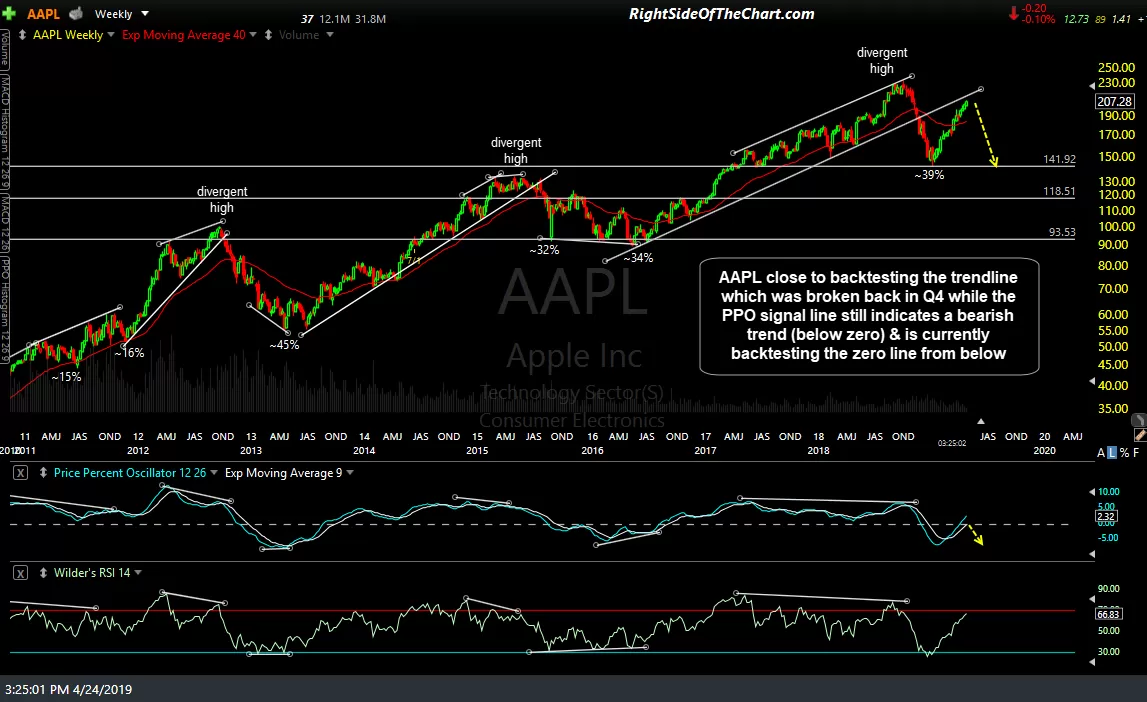
Last but certainly not least, the FAAMG earnings blitz will conclude with AAPL (Apple Inc.) reporting after the market closes next Tuesday, April 30th. AAPL remains solidly within an uptrend but precariously close to the uptrend line off the Dec 24th lows as with the other FAAMGs & is also close to backtesting the primary uptrend line on the weekly chart while the PPO signal line/9-ema, remains in bearish territory, below the zero line, while backtesting that bullish/bearish trend delineation line from below.
-
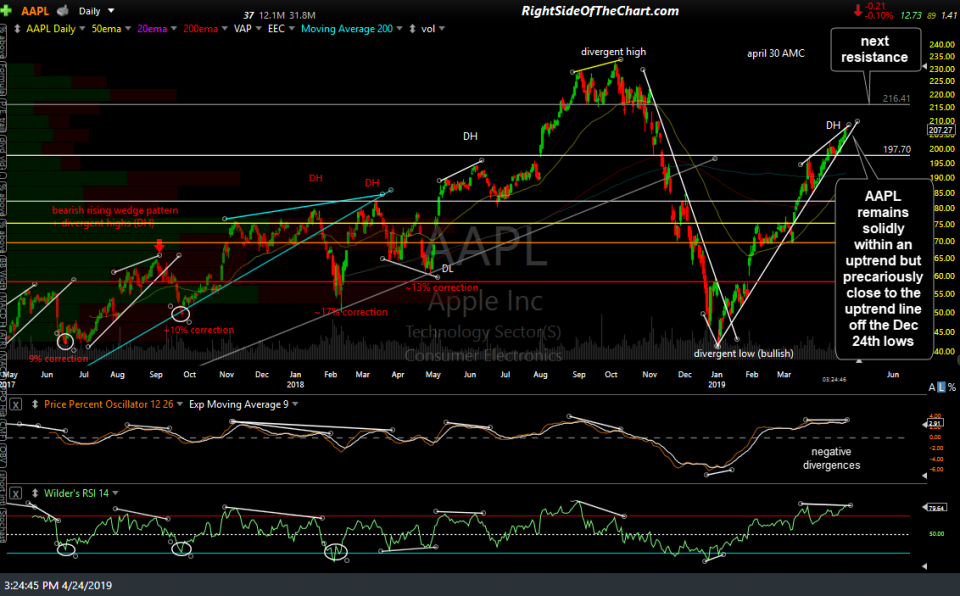
- AAPL daily April 24th
-
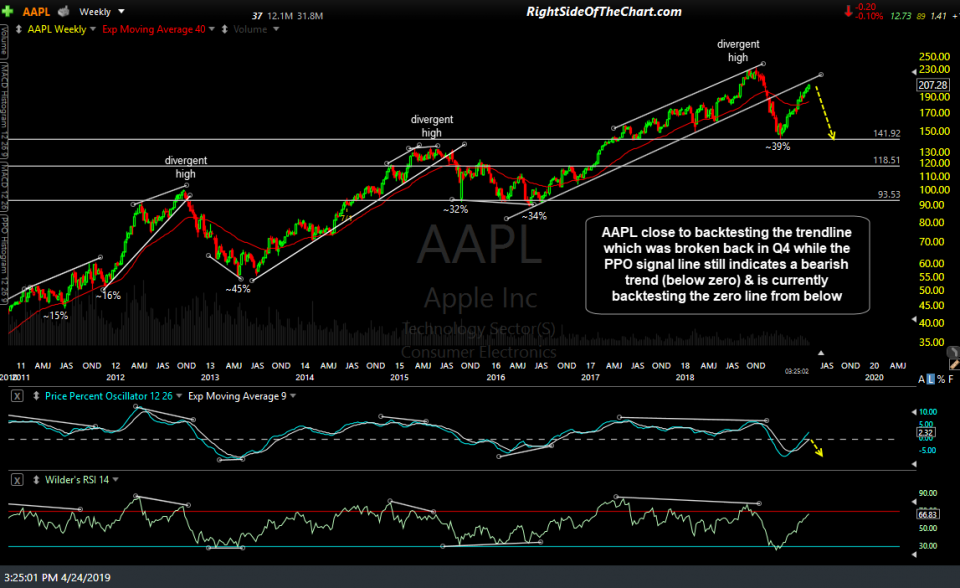
- AAPL weekly April 24th
Keep in mind that what’s important isn’t whether or not these market-leading stocks, or any company for that matter, meet, beat or miss their earnings estimates or whether they offer rosy or lousy guidance, more so how the market reacts afterwards. Also, best to not read too much into the immediate reaction in the after-hours or pre-market trading session but rather let the dust settle & see how a stock trades in the regular trading sessions that follow their earnings report & any forward guidance.