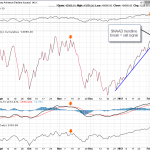
not much add to what was already covered on friday although I did note that the uptrend line on the recently posted $NAAD chart broke down and has triggered a sell signal also making a perfect turn-down off that larger downtrend line (so far). click here and here to view those previous charts posted on wednesday and see the updated daily chart below. also note that on friday, the RSI 14 on the QQQ turned down and closed at 74.79, after hitting a peak extreme reading of 82.06 on thurday (click here to reference the prior chart illustrating the potential significance of such readings).
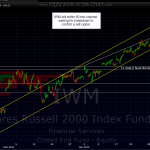
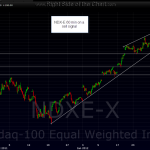
so to summarize, we have several good short-term to intermediate term sell signals in place in conjunction with some, but not yet all, 60 minute uptrend line breaks on the primary indices. i have updated all the key 60 min charts below noting those that have already given sell signals (broken down) and those that have yet to. most of these charst list targets which are not only helpful for trading the indexes but may also be useful in determining when to cover some individual stock shorts. for example, i will often cover or hedge my individual stock shorts when the broad markets fall to a key support area/bounce target.
currently, there are plenty of trade set-ups and active trades close enough to entry on the site, both long and short although the majority of set-ups and active trades right now are shorts because the risk/reward profiles are tilted that way right now. i do plan to look for some additional set-ups early this week, most likely tomorrow. good luck and good trading this week.


