at times like this, do i feel like i’m missing out on some nice long-side trade entries by ignoring all the bullish pattern breakouts? sure. do i feel guilty for bending some of my trading rules by giving some of my short-positions more rope that i normally would? absolutely. however, although i’ve said this before recently, i’m going to sit on my hands into next week to see what kind of follow-thru we get to today’s move. although today’s action might feel very bullish, the SPX and NDX are only up about 1.25% and the SPX has still yet to clearly take out that key resistance level so i will continue to keep things light for now and see what kind of follow-thru we get next week.
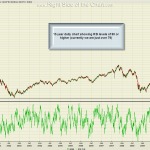
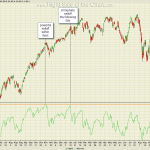
on a related note, although there are several indicators used to measure how oversold or overbought a security or index is on any given time frame, my favorite has always been the simple, yet effective RSI. taking a look at the lead sled dog in this race (the QQQ/$NDX), the first chart below shows a 15 year history of prices (daily time frame) plotted against the RSI with a horizontal line added at the 80 level. what strikes me is that other than the 3 most recent 80+ readings, which all occurred within a 1 year time span circa the recent unprecedented central bank flooding of liquidity commonly know as quantitative easing, the last time that the Q’s ever printed RSI readings at that level was at the tail end of 1999, yes, right at the final stages of the biggest stock market bubble in history.. the .com bubble. even the roaring, fed induced, housing/credit bubble-fueled bull market of ’02-07′ couldn’t manage to print such readings on the daily RSI. today’s last print was just north of a 79 reading and as the 2nd chart below shows, sometimes the market manages to get even more overbought or ignore these readings for a few days but history has shown that fast, often gap induced, corrections are usually not too far away following these 80+ prints.
maybe another gap up on monday to push the RSI over 80? maybe another week of prices climbing higher? maybe, maybe not. although i can’t see into the future, i can certainly view history (the charts) see how the market has followed thru during similar periods in the past. does the same pattern have to continue to play out, of course not. remember, i am highlighting only one single chart indicator below. there are countless other factors and variables in play at any one time in the market and i’m sure if i sat down and took the time, i could make a bang-up case for being long here as well. in fact, just to play devil’s advocate, i will say that the weekly RSI readings on the key indices are still well below overbought levels not to mention that the recent decline in the internals proved to be temporary. by many accounts and metrics, including the most important (price action) the market can be interpreted as very bullish right now. however, i did want to point out these daily RSI readings and the subsequent price history as one reason i am keeping things light for now and giving a little extra wiggle-room to some of my existing short positions.


