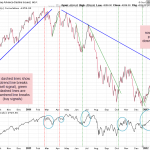
one thing that i should have mentioned regarding those $NAAD buy/sell signal charts below; we are currently testing a key downtrend line, which aligns well with the fact that the market is still +/- within a key resistance area that could determine whether the next 20%+ move from here is higher or lower. again, like everything else, this indicator is not fool-proof but could prove useful when used in conjunction with other trend indicators to help either confirm the uptrend is still intact or to warn of a possible trend reversal if we are rejected off this key downtrend line and breakdown from the existing uptrend line on the previous chart.
Results for {phrase} ({results_count} of {results_count_total})
Displaying {results_count} results of {results_count_total}


