
I sat down earlier tonight to put together a weekly outlook for the broad market but struggled to find anything new worth mentioning. The broad market (S&P 500) closed the week right around the mid-point of the 2.8 month trading range and with such tight, sideways price action, the price & momentum oscillators & indicators provide little, if any clues as to the next major trend in the market although longer-term charts continue to indicate that the next major trend in the US equity markets will be to the downside.
The Nasdaq Composite ($COMPQ) & Nasdaq 100 ($NDX) have been doing most of the heavy lifting for quite some time now, with those tech-heavy indices being lifted by fewer & fewer mega-cap, over-owned & over-loved stocks such as AMZN, FB, AAPL, GOOG & MSFT. I recall the same thing happening leading up the 2007 market top as well, with fewer & fewer top-weighted components of the Nasdaq carrying the market higher just as they are now, as evidenced by the powerful divergences that continue to build as the Nasdaq Advance-Decline Line ($NAAD) fails to make new highs along with the Nasdaq Composite & Nasdaq 100.
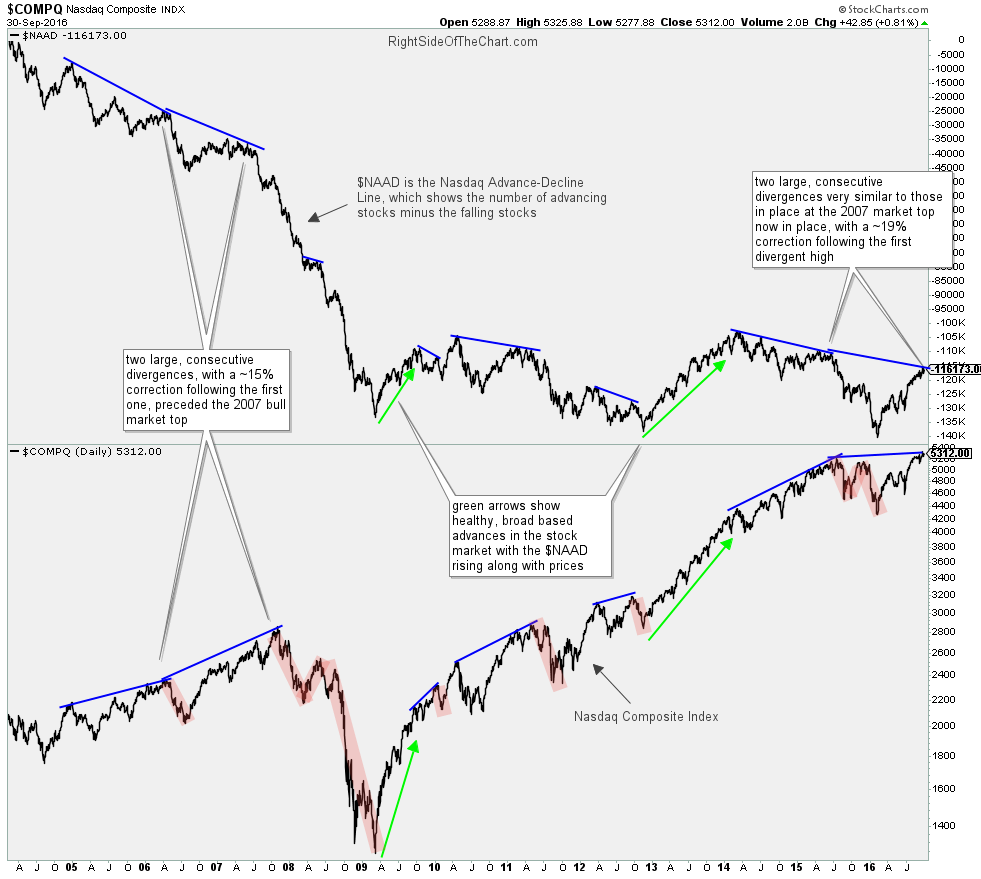
$NAAD vs. $COMPQ Oct 2nd
As potential bullish or bearish developments on the long-term charts can take months or even years to play out in the form of a lasting trend reversal, I’ll continue to post only periodic updates on any existing & new developments on the daily & weekly time frames while continuing to focus primarily on any significant developments on the 60-minute time frames, most notably a definitive break above or below the recent 2.8 months sideways trading ranges.
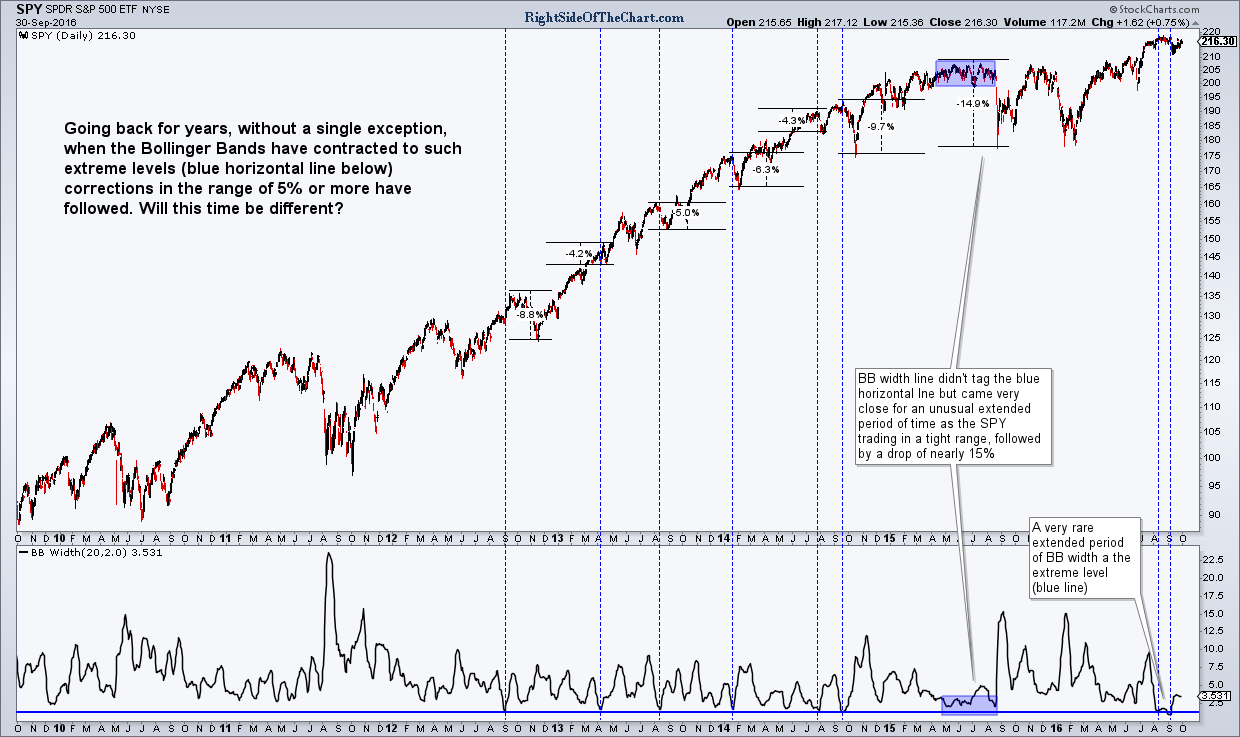
SPY Bollinger Bands Contractions Oct 2nd
Despite the fact that swing trading any stocks with a decent correlation to the broad market has been unusually difficult lately due to this choppy, sideways price action, I continue to look for any individual stocks or sectors that stand out as attractive trade setups & have added quite a few to my watchlist over the weekend, both longs & shorts. I plan to cull that list down to the most attractive & timely trade ideas that stand out at this time & will share those in video format and/or posted as new trade setups starting tomorrow morning. I’d like to share as many of the more promising trade ideas out in advance, as to allow everyone ample time to review them, as some of the most power moves in the market have historically occurred in October. Add to that the fact that large, powerful moves often come following periods of unusually low volatility & price compression, as evidenced by the chart above which highlights the recent extreme pinching of the Bollinger Bands along with the sharp moves that have followed all previous extreme contractions in the Bollinger Bands in recent years.
This market won’t lie idle forever so best to have all your ducks in a row for when the next sharp trend starts to get underway. That includes outlining, in advance, trading plans for your favorite setups, including where you plan to enter, where you plan to exit, how much capital you plan to deploy to each trade and sector, etc… Price alerts are a must for a swing trader as there are times when I have trade setups triggering entries one after another in very short order & it can be quite some time before I can post an update or mention the breakout in the trading room.
Have a great evening/trading week. -RP