
I recorded a comprehensive video earlier today covering the charts of the Nasdaq 100 ($NDX), QQQ, as well the top components of that market leading (or until recently) index, covering various time frames on each. The video ran quite a bit longer than expected so I’ll post it at the bottom for those interested & that have the time to watch it. Essentially, the case was laid out that the Nasdaq 100 still appears poised for a meaning correction and/or more lasting trend reversal with some work still to be done in order to firm up the intermediate & longer-term bearish –or- the bullish case, should the current bearish technicals start to dissipate in the coming weeks & months.
While a good part of that video is spent discussing the developments on the longer-term charts, such as weekly & monthly time frames going back a decade or more, I also cover the near-term outlook & key technical levels for the Nasdaq 100 as well as the top components which account for the bulk of the returns of that index. For those that don’t have the time or inclination to watch the video, here’s a quick look at what I’m watching today. QQQ remains well below the 117.50 daily stop-trigger while failing to close above the key 116.00 level so far since the $NDX printed the large bearish engulfing candlestick last Thursday. Will today’s rally continue to build into the close or be faded to see the Q’s once again close on or below that level?
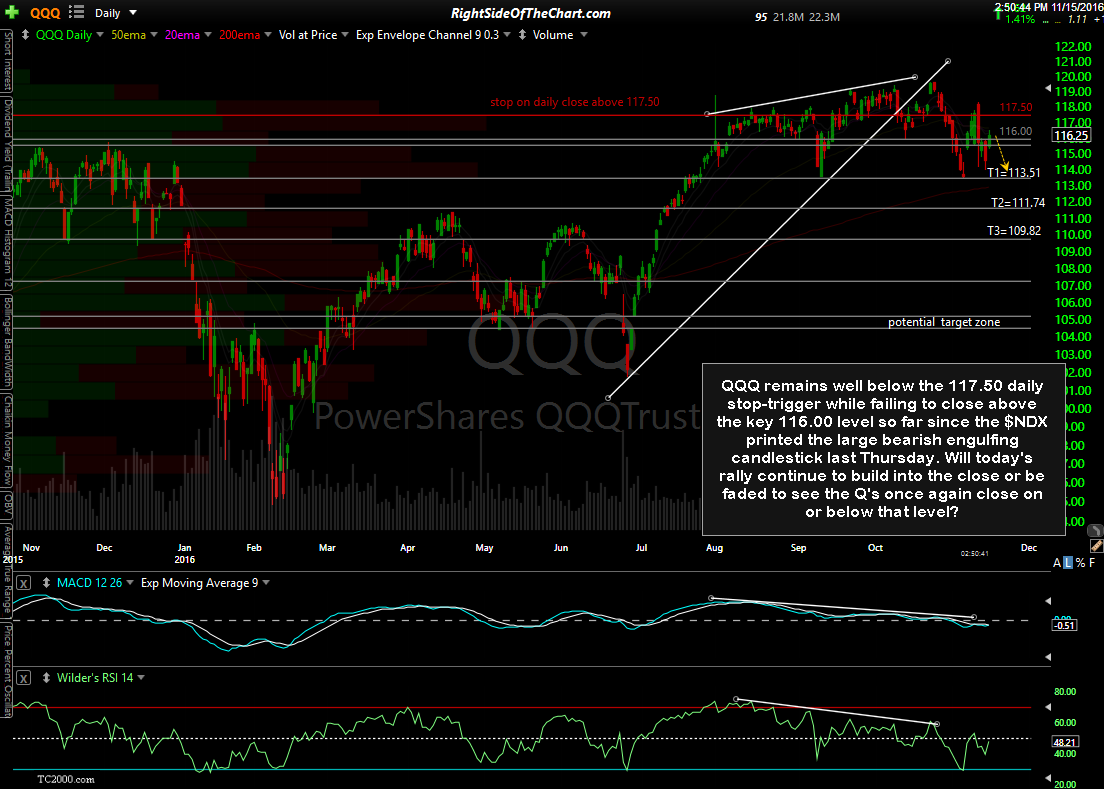
QQQ daily Nov 15th
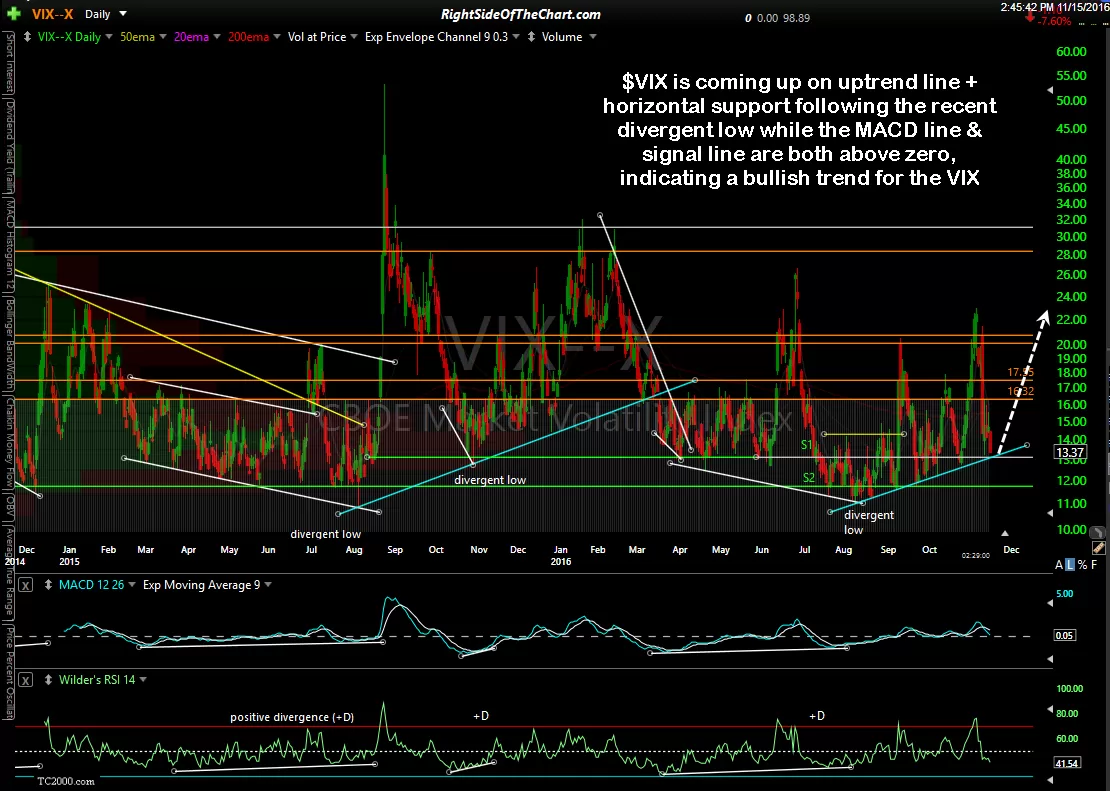
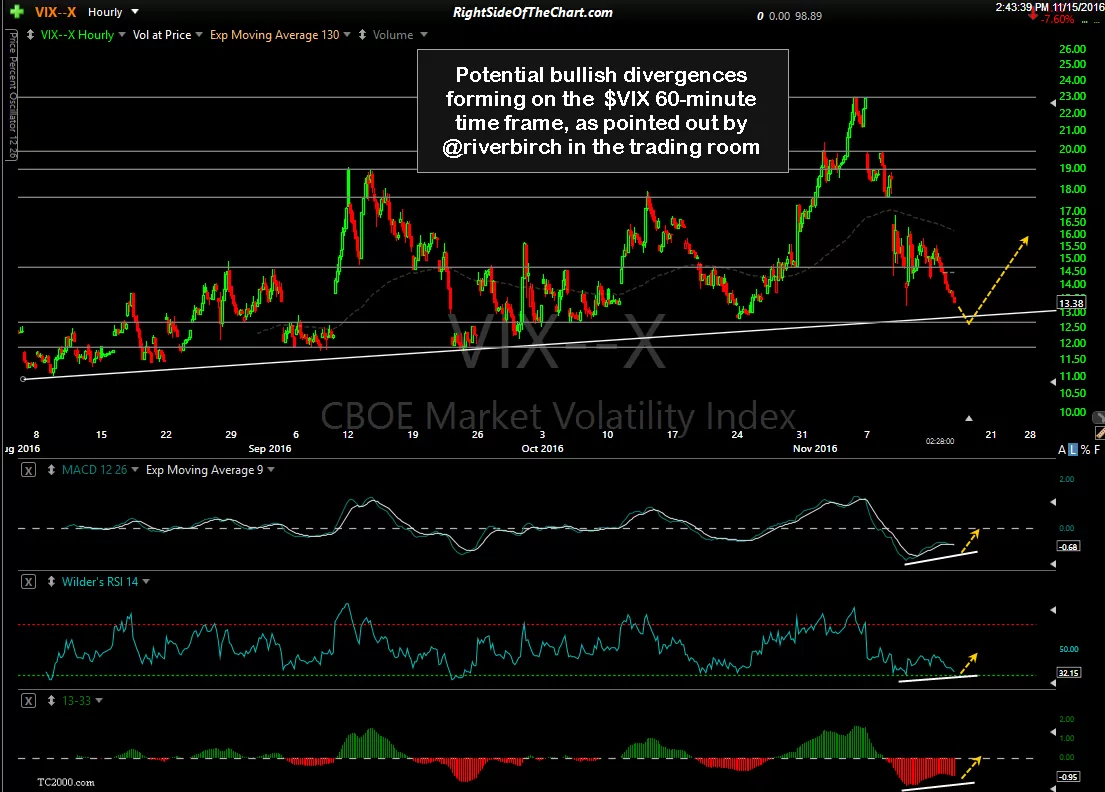
$VIX is coming up on uptrend line + horizontal support following the recent divergent low while the MACD line & signal line are both above zero, indicating a bullish trend for the volatility index. The case for a reversal off that trendline can be made by the potential bullish divergences forming on the $VIX 60-minute time frame, as pointed out by @riverbirch in the trading room (thanks for the heads-up!).
-

- $VIX daily Nov 15th
-

- $VIX 60-minute Nov 15th
It’s rarely coincidence when the broad market runs into resistance while the $VIX falls to support around the same time. Although not shown here, IWM is also at resistance, currently challenging its previous all-time high from back on June 24, 2015. My thoughts on IWM are in this reply below (pasted from the trading room), which was in response to a question about the likelihood of this being a blow-off top vs. a breakout in the small cap index:
Again, for those interested in an in-depth but lengthy (40 minute) analysis of the Nasdaq 100 & top components, here’s the video: