
The following video provides technical analysis of the US stock market, gold, silver & platinum. Silver or Gold level access initially required.
playback speed can be increased in the settings to reduce video duration
I had inadvertently stopped recording at the end of the video just before adding my closing comments so the video may seem to end abrupty although I covered all of the charts that I had intended to other than this 120-minute chart of GLD (gold ETF), highlighting a key uptrend line & support zone which has contained the recent pullbacks.
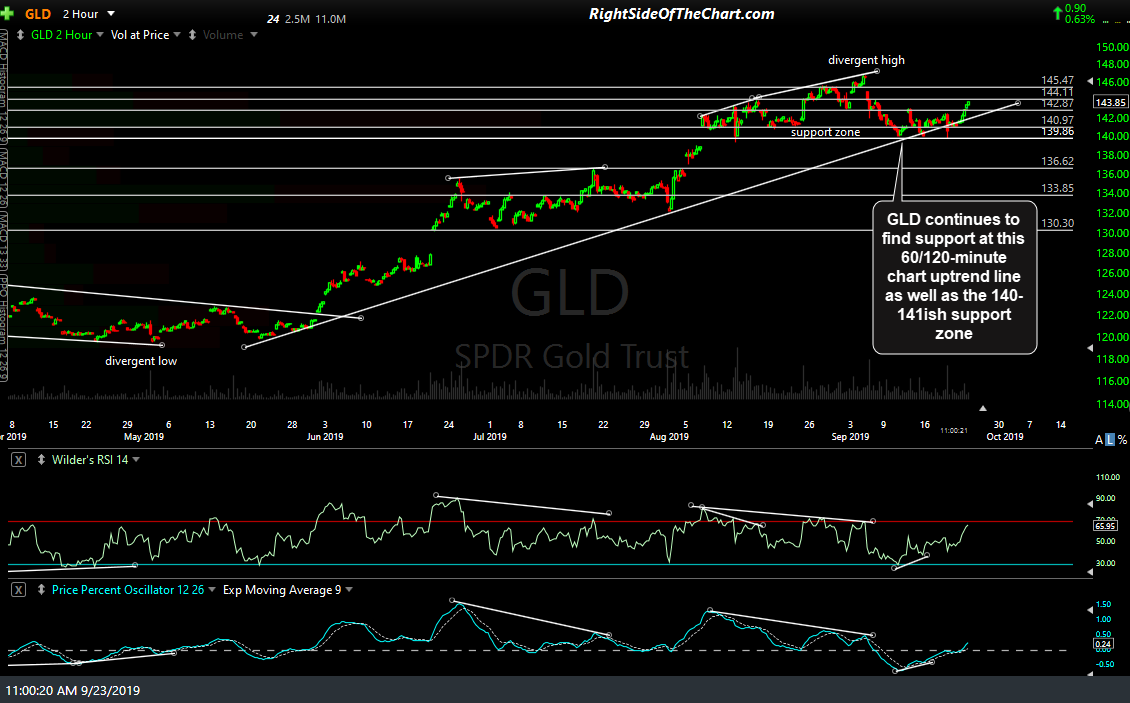
GLD 120m Sept 23rd