
The video below covers the US equity markets via SPY, QQQ & IWM in addition to expanding on several reasons why the breakout to new highs in the S&P 500 could fail soon. Towards the end of the video, the charts of each sector within the S&P 500 are covered. Eight of the ten sectors within the $SPX are still trading below their highs as are the majority of the top 10 components of the index. The fact that the index is trading at all time highs despite its individual sectors & top holdings not confirming could be due to stock rotation or it could have something to do with the methodology now used to calculate the returns which are discussed in this article: The S&P 500’s Dirty Little Secret-How Quiet Changes in the Methodology Are Fundamentally Transforming the Index.

SPY daily July 12th
QQQ/$NDX is currently challenging a key resistance level, the top of the New Year’s gap, with potential negative divergence in place.
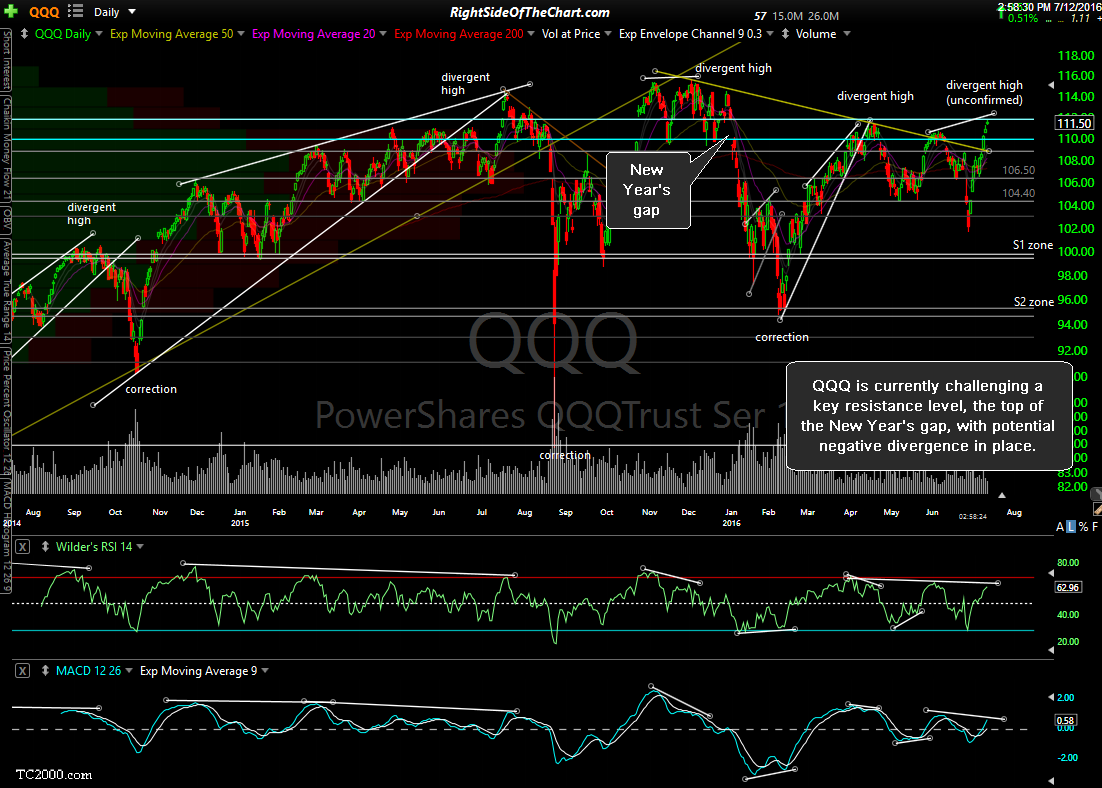
QQQ daily July 12th
IWM/$RUT is challenging the Nov 30, 2015 reaction high (resistance) with potential negative divergences in place while near-term overbought to boot.
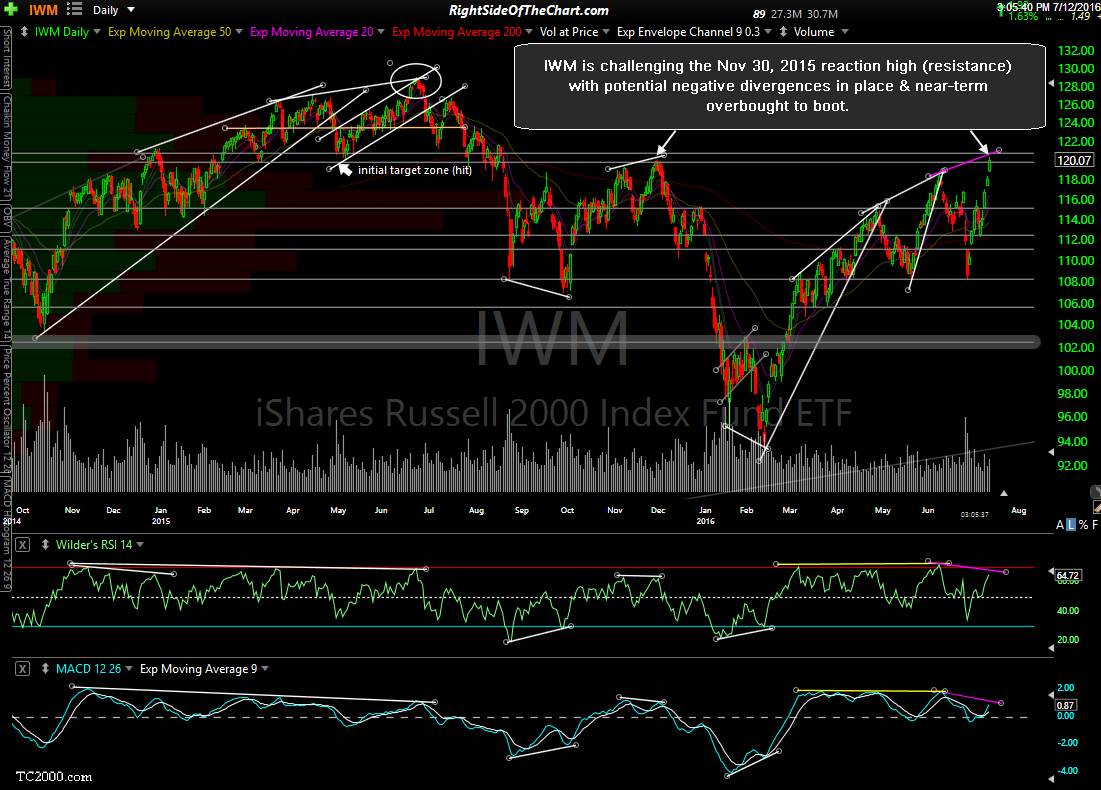
IWM daily July 12th