
As promised, if there was any big movement in the futures overnight I would fire off an early post. Stock futures were drifting modestly lower last night but starting moving sharply lower after 6am when China (as expect… so will take this drop which should have already been price in as a potential buying opp). While the odds of something “breaking” (i.e.- a big fund, financial firm, etc..) always increases when the stock market has fallen this much in relatively short order, the odds for an outright crash are elevated & just can’t be ruled out.
With that being said (and that warning should not be taken lightly), what I can also say is that both the major stock indices as well as several of the market-leading Magnificent 8 stocks has just fallen to solid (strong) support in the pre-market session. As I like to say, support is support until & unless broken so while I believe this drop to support offer an objective level to cover shorts and/or enter longs for what could easily be a double-digit bounce in the coming days/weeks, one should make sure to manage both position sizing and stops to manage/mitigate risk… full disclaimer, hard stop.
/NQ (Nasdaq 100 futures) has just hit my 17960 price target* with potential divergence forming, with QQQ & SPY, AAPL, MSFT, NVDA, etc.. also at support thereby offering an objective level for active traders to cover short and/or go long here as well as the 17356 support somewhat below, should /NQ continue lower. My current preferred bounce target at this time, assuming that /NQ does reverse around current levels or down to but not below that next target around 17356, would be just shy of that 19013 target which was already taken out (support, once broken, becomes resistance). Previous (March 12th) and updated daily charts below. (*The previous chart was the March futures contract so the exact price levels of those targets have changes as the contracts has rolled. You can see these nearby targets has the same previous reaction points on both charts).
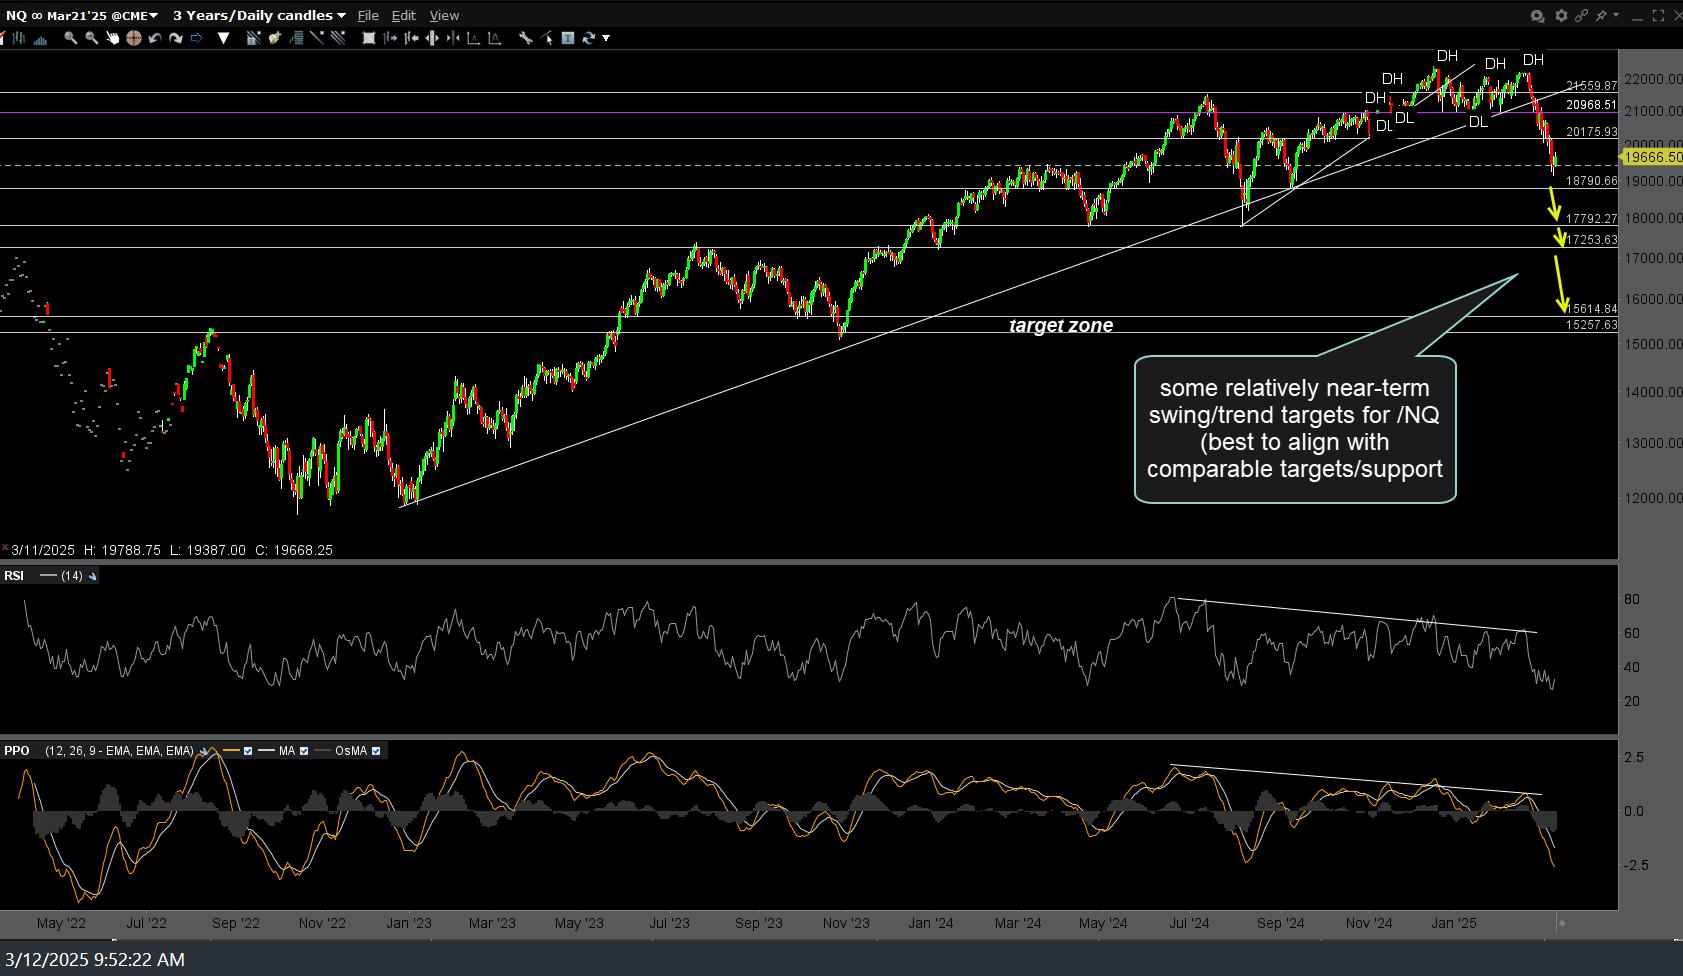
NQ-daily-March-12th
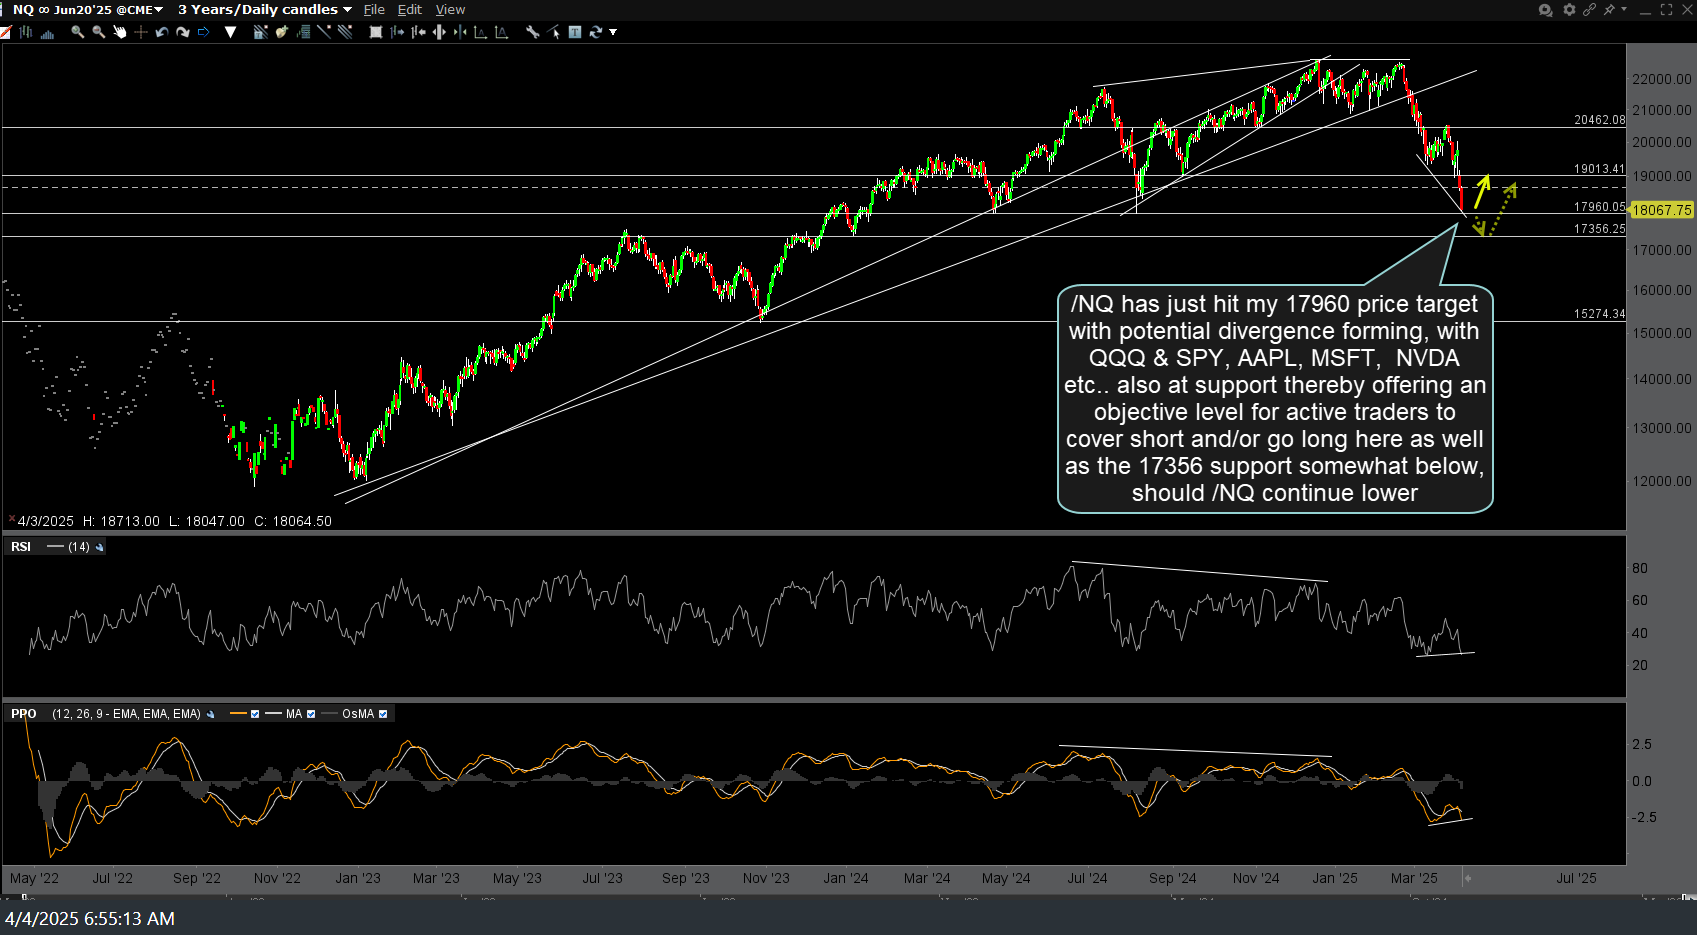
NQ daily April 4th
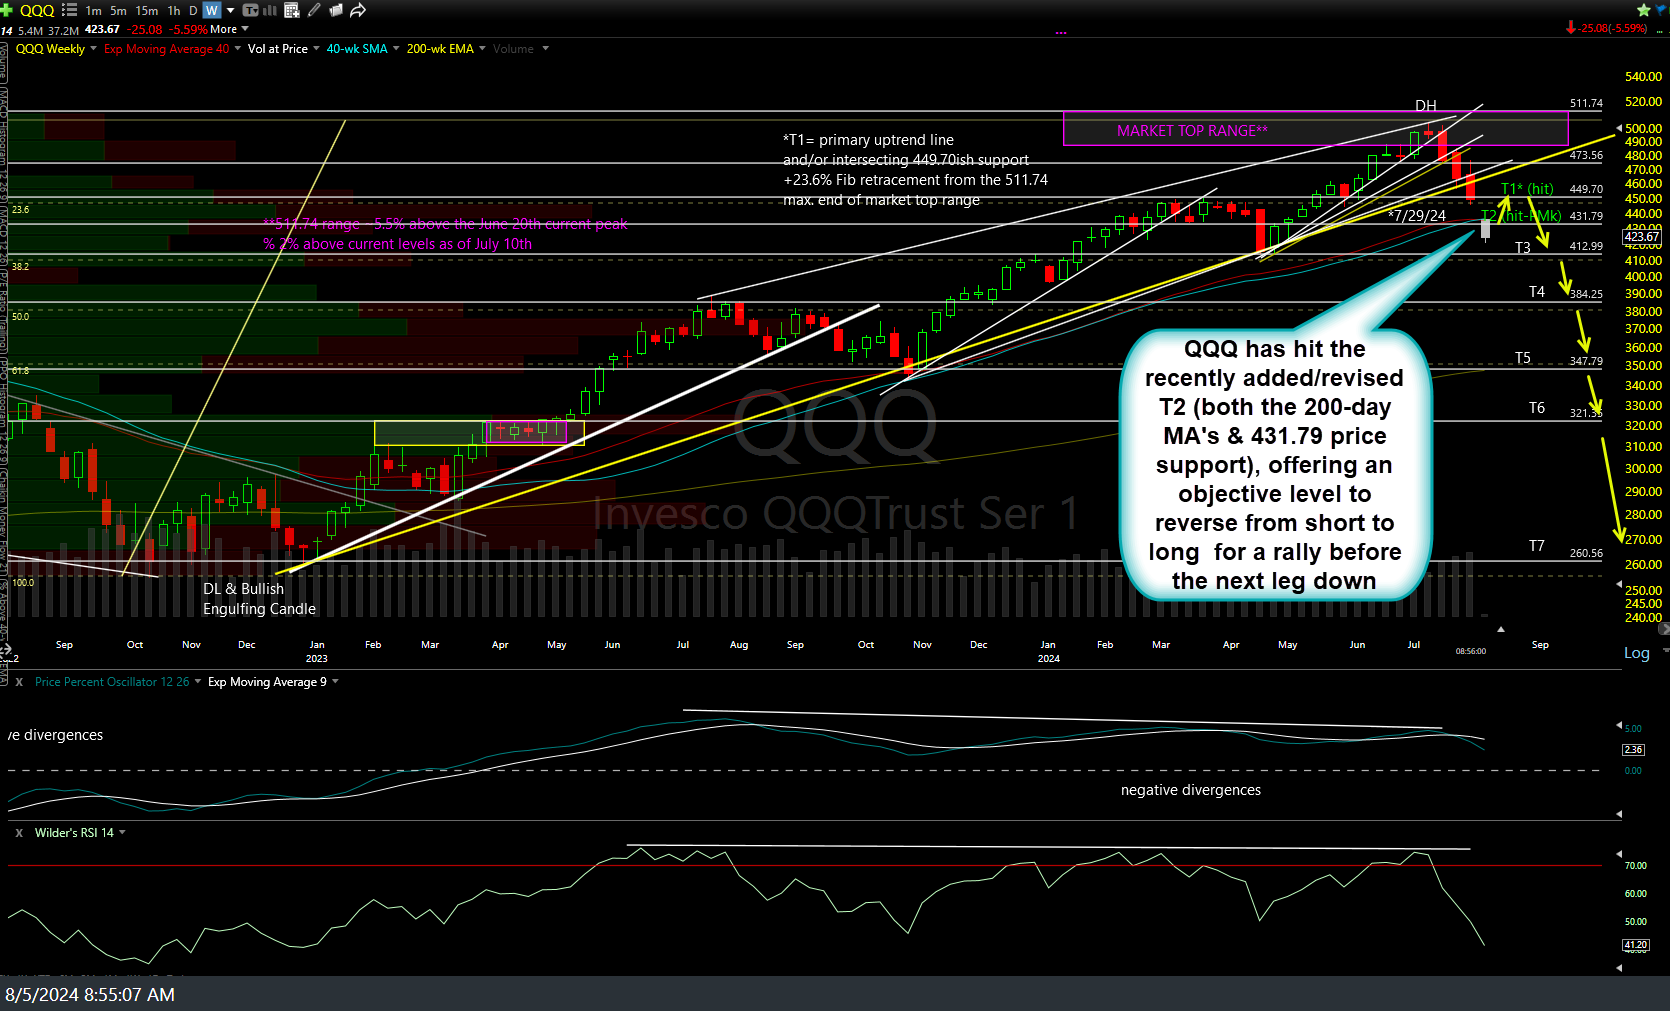
QQQ (Nasdaq 100 ETF) is also approaching both the long-term T2 (which was hit when we hit it & the 200-day MA’s & made a “hard reversal” to cover all shorts & go full long back at the Aug 5th lows) as well as measured target for the recent bear flag patter where a the odds for a tradable bounce are likely. Previous (Aug 5th, Oct 14th) an updated weekly chart below.
QQQ weekly Aug 5th

QQQ weekly Oct 14th

QQQ weekly April 4th
NVDA (NIVIDA Corp) has just hit the first long-term T1 (support) in pre-mkt for the 2nd time since those targets were first laid out at the 2024 highs. Previous (Feb 20th) and updated weekly charts below.

NVDA weekly Feb 20th

NVDA weekly April 4th
AAPL priovides an objective level to cover shorts & reverse to long here at my T4 (final near-term swing, not long-term trend) target zone which is strong support. Daily chart below.
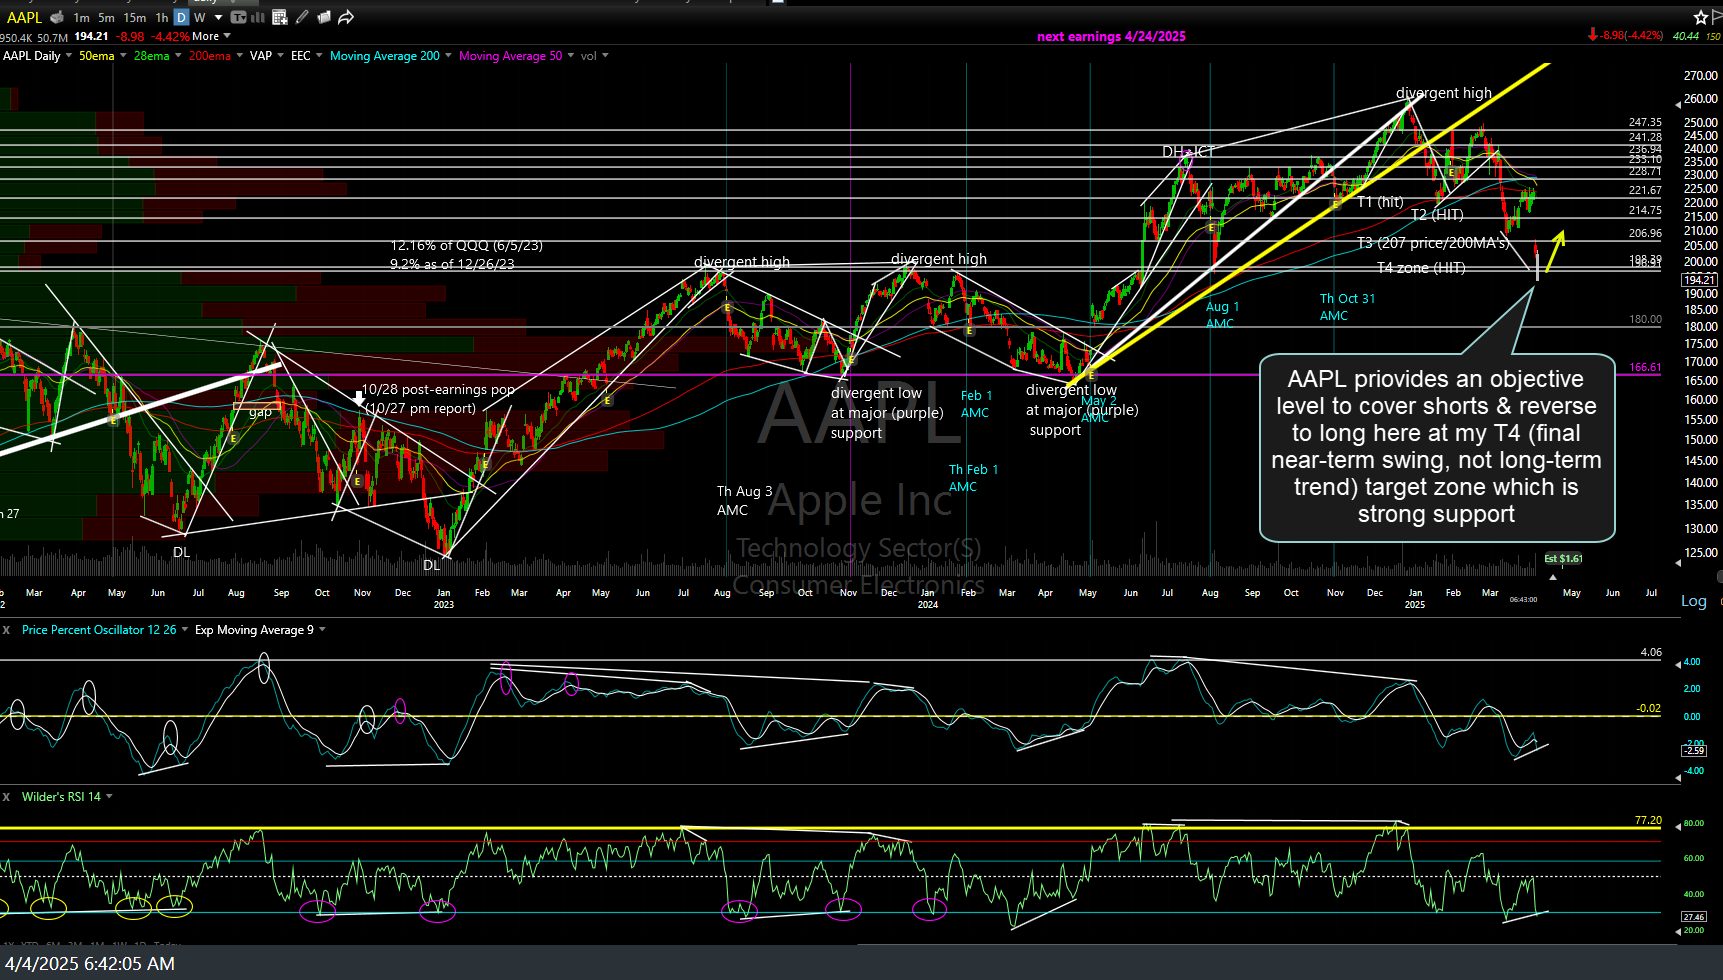
AAPL daily April 4th
MSFT has fallen to uptrend line + the key 364ish price support with potential divergences forming between price & the momentum indicators. Daily chart below.
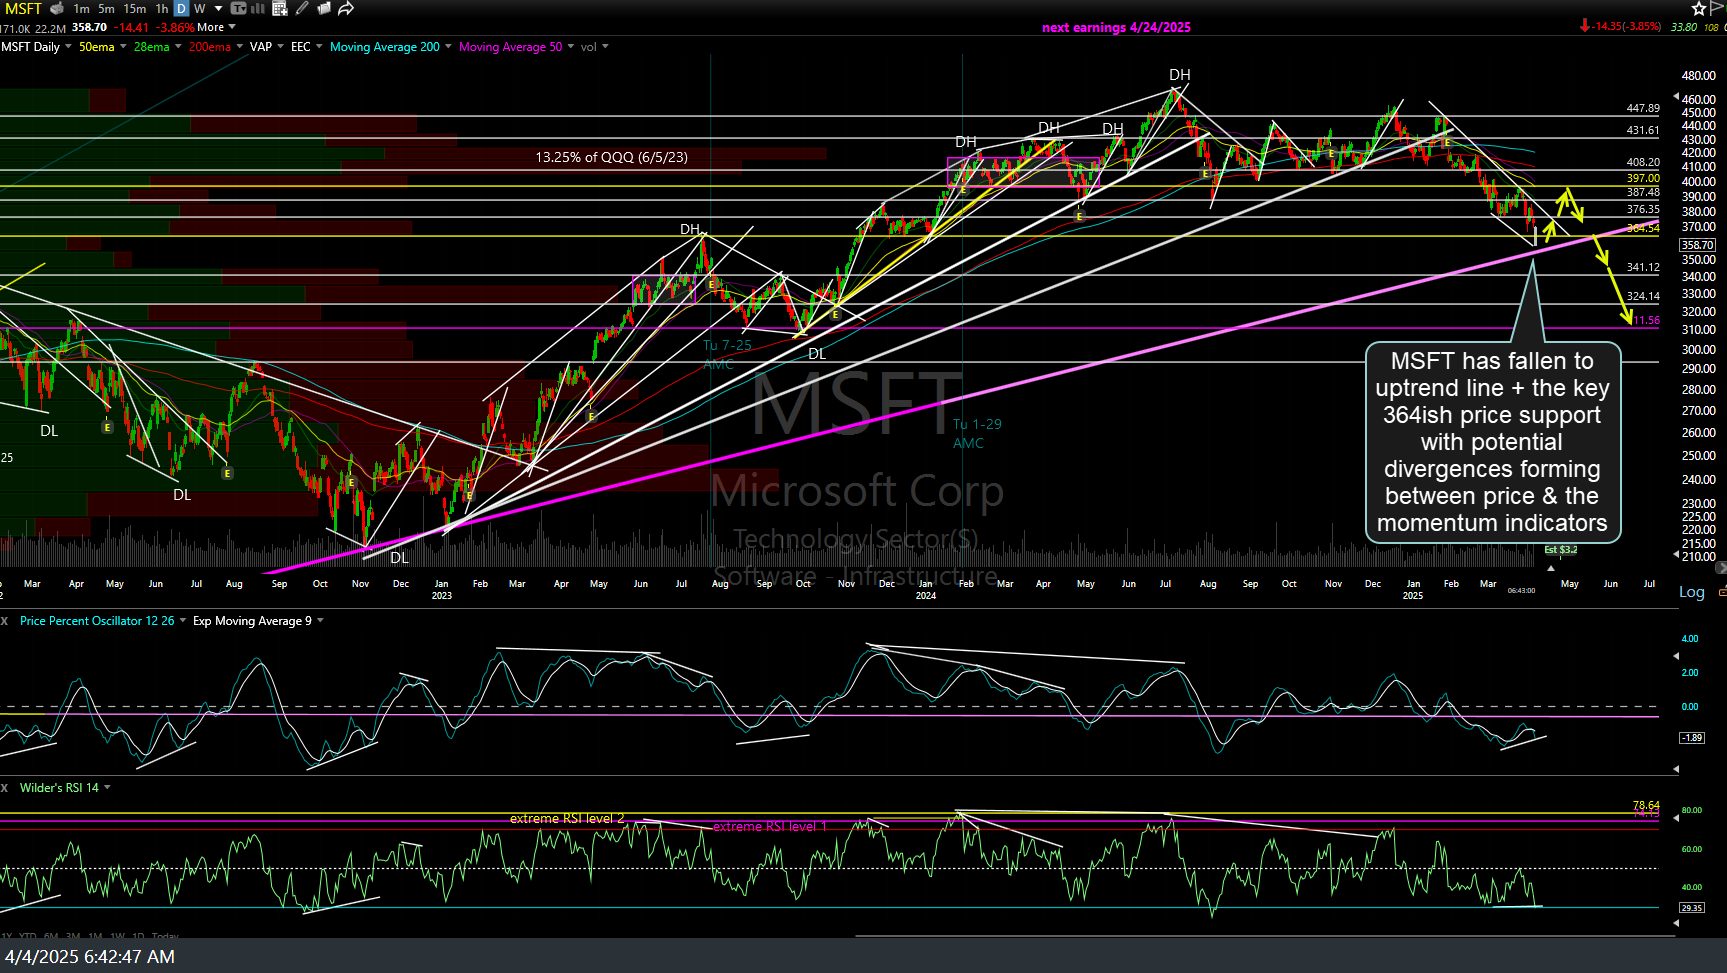
MSFT daily April 4th
VIXY, the short-term $VIX ETF swing trade, is also approaching T2, up about 80% from entry, not including the reversal (profits booked & short pullback and/or re-entry at the scale-back-in-zone) although based on the indexes & key stocks at or very near key support in the charts above, those planning to book profits at T2 might opt to either book profits here or simply raise/set a relatively tight stop below the current pre-market levels. Daily chart below.

VIXY daily April 4th