
In the past, I’ve shared my ‘low-volume’ indicator which typically precedes significant corrections in the stock market. I use a 10-day Exponential Moving Average of the volume on a daily chart of the major stock indices (SPY, QQQ, IWM, etc…) while placing a red line at the extreme-low levels which often precedes significant corrections. Quite often, a drop to the ‘red line’ will be followed by a correction in a relatively short amount of time (a couple of days to a few weeks) while occasionally, the average trading volume can stay persistently low for up to a few months before a tradable correction sets in. It is worth noting, however, that the periods of extended persistently low-volume are usually followed by much larger corrections such as the ~20% drop in Q4 2018 as well as the ~35% plunge in Q1 2020.
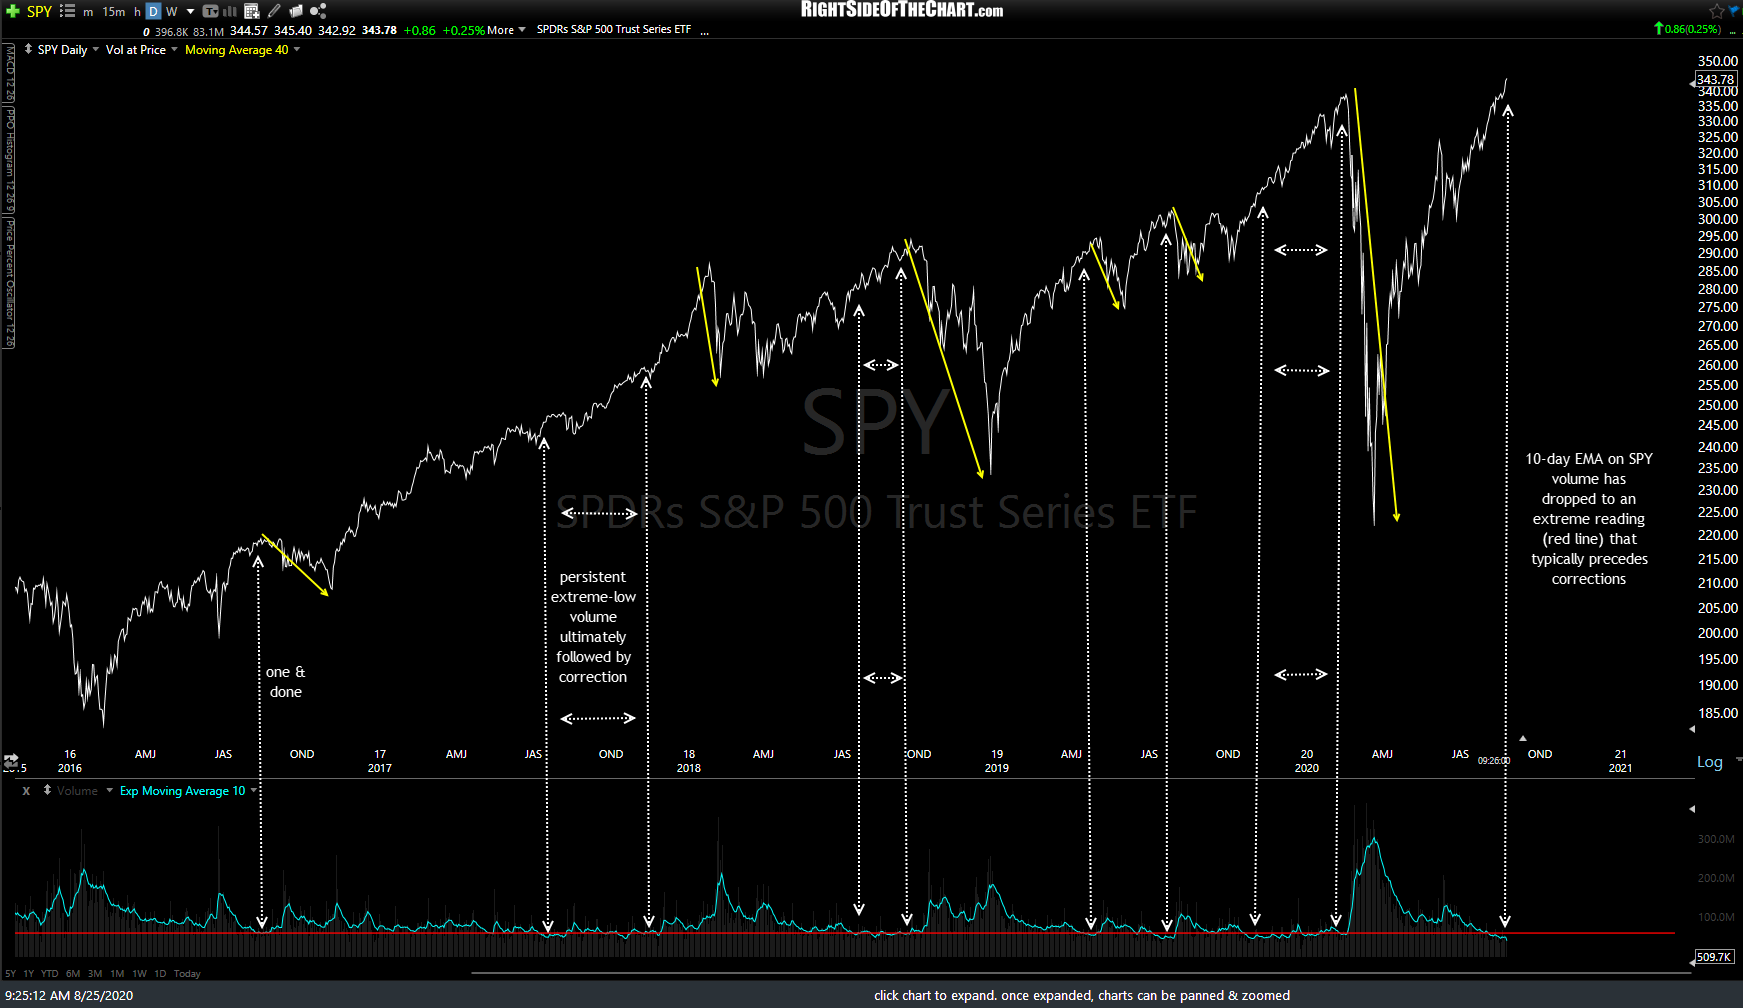
SPY daily Aug 25th
As drops to these extreme low volume levels can either provide a “one & done” sell signal, with a correction starting shortly afterward or up to several months later, this should not be used as an exact timing indicator, rather a “heads up” indicator that should be used in conjunction with other technicals to help zero in on the timing of a sell signal such as trendline, price support, and/or bearish chart pattern breakdowns; bearish candlestick reversal patterns, etc…
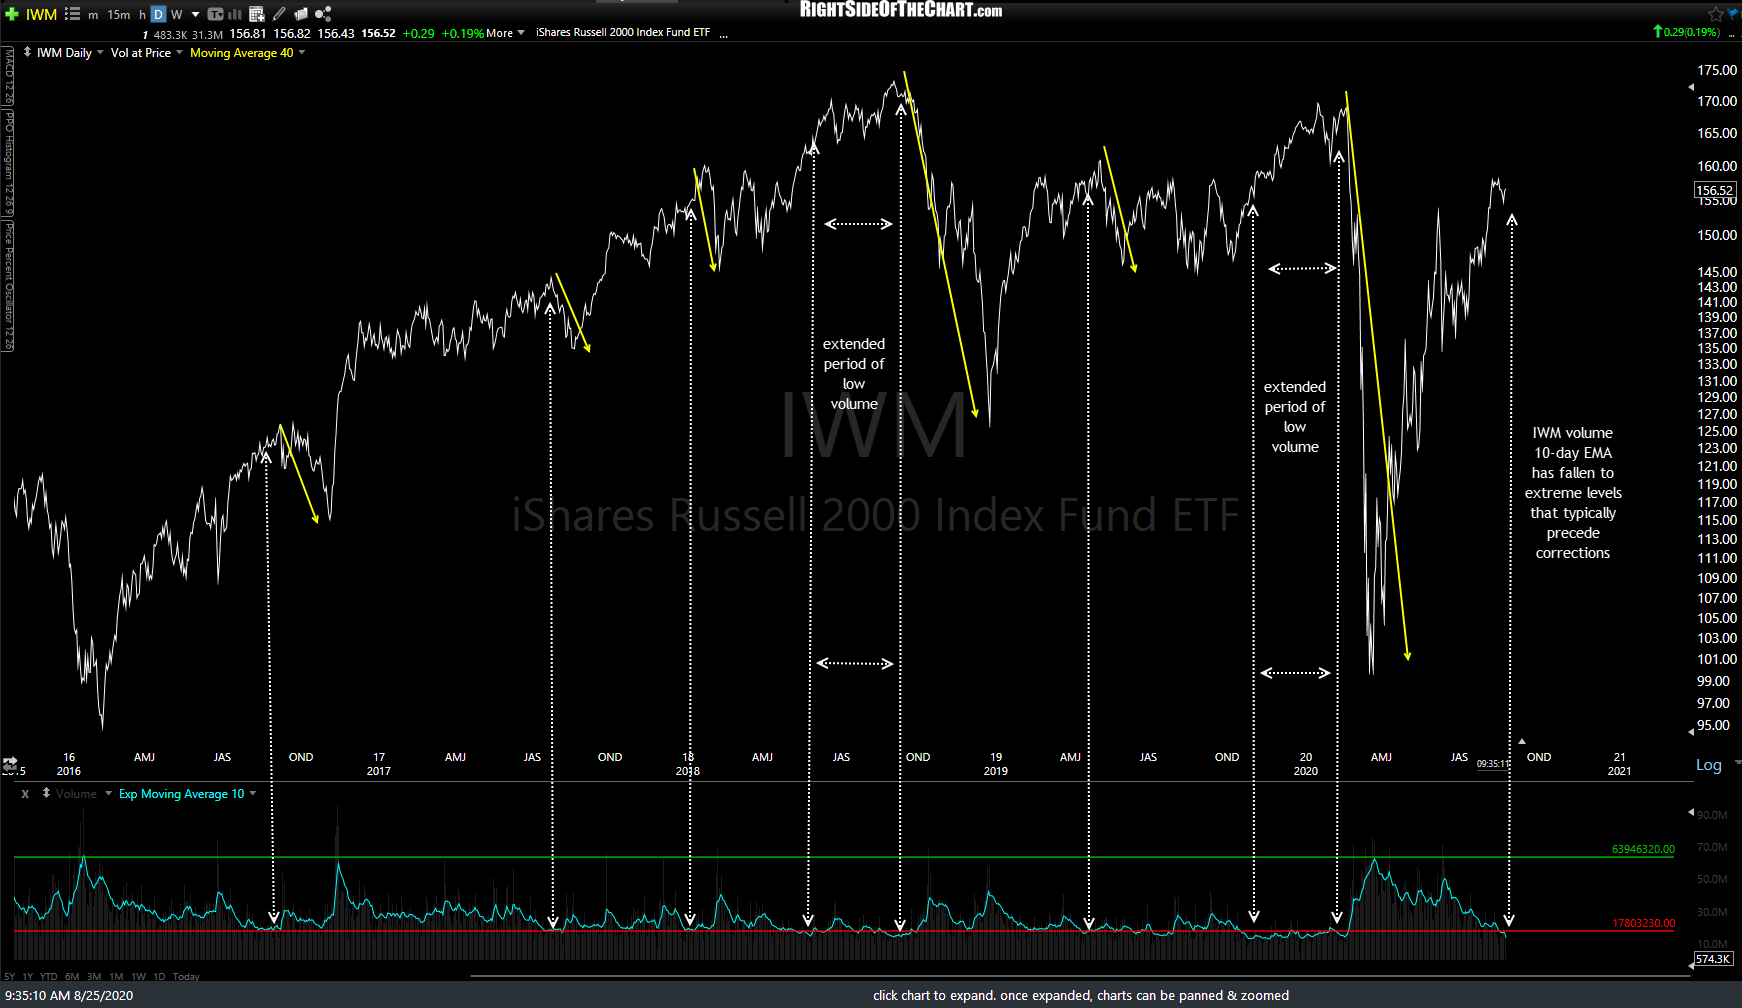
IWM daily Aug 25th
Regarding the timing of those sell signals, on the daily time frames, I’m still awaiting solid breaks and/or daily closes below the blue uptrend lines on SPY & QQQ. Note: multiple charts in gallery formats, as below, will not appear on the subscriber email notifications but may be viewed on rsotc.com (short url)
-
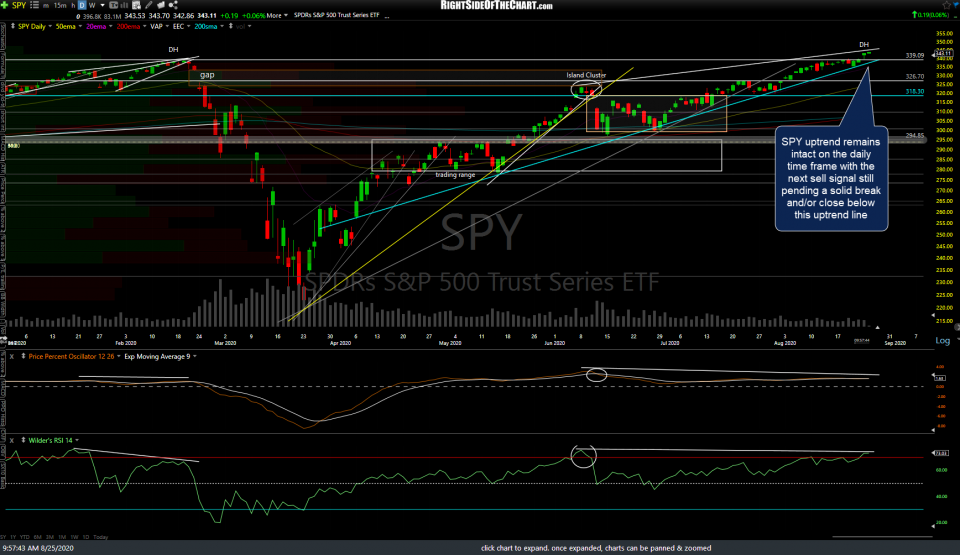
- SPY daily 2 Aug 25th

-
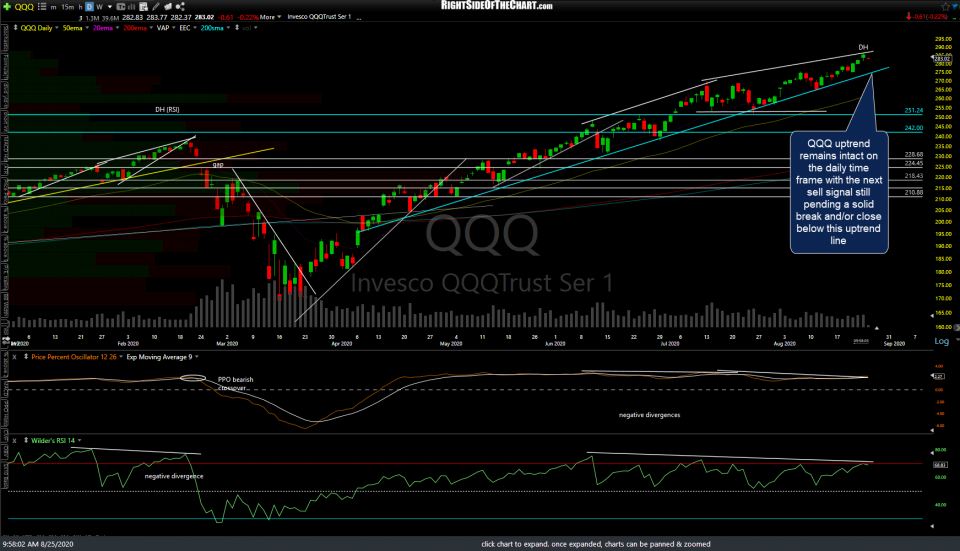
- QQQ daily Aug 25th

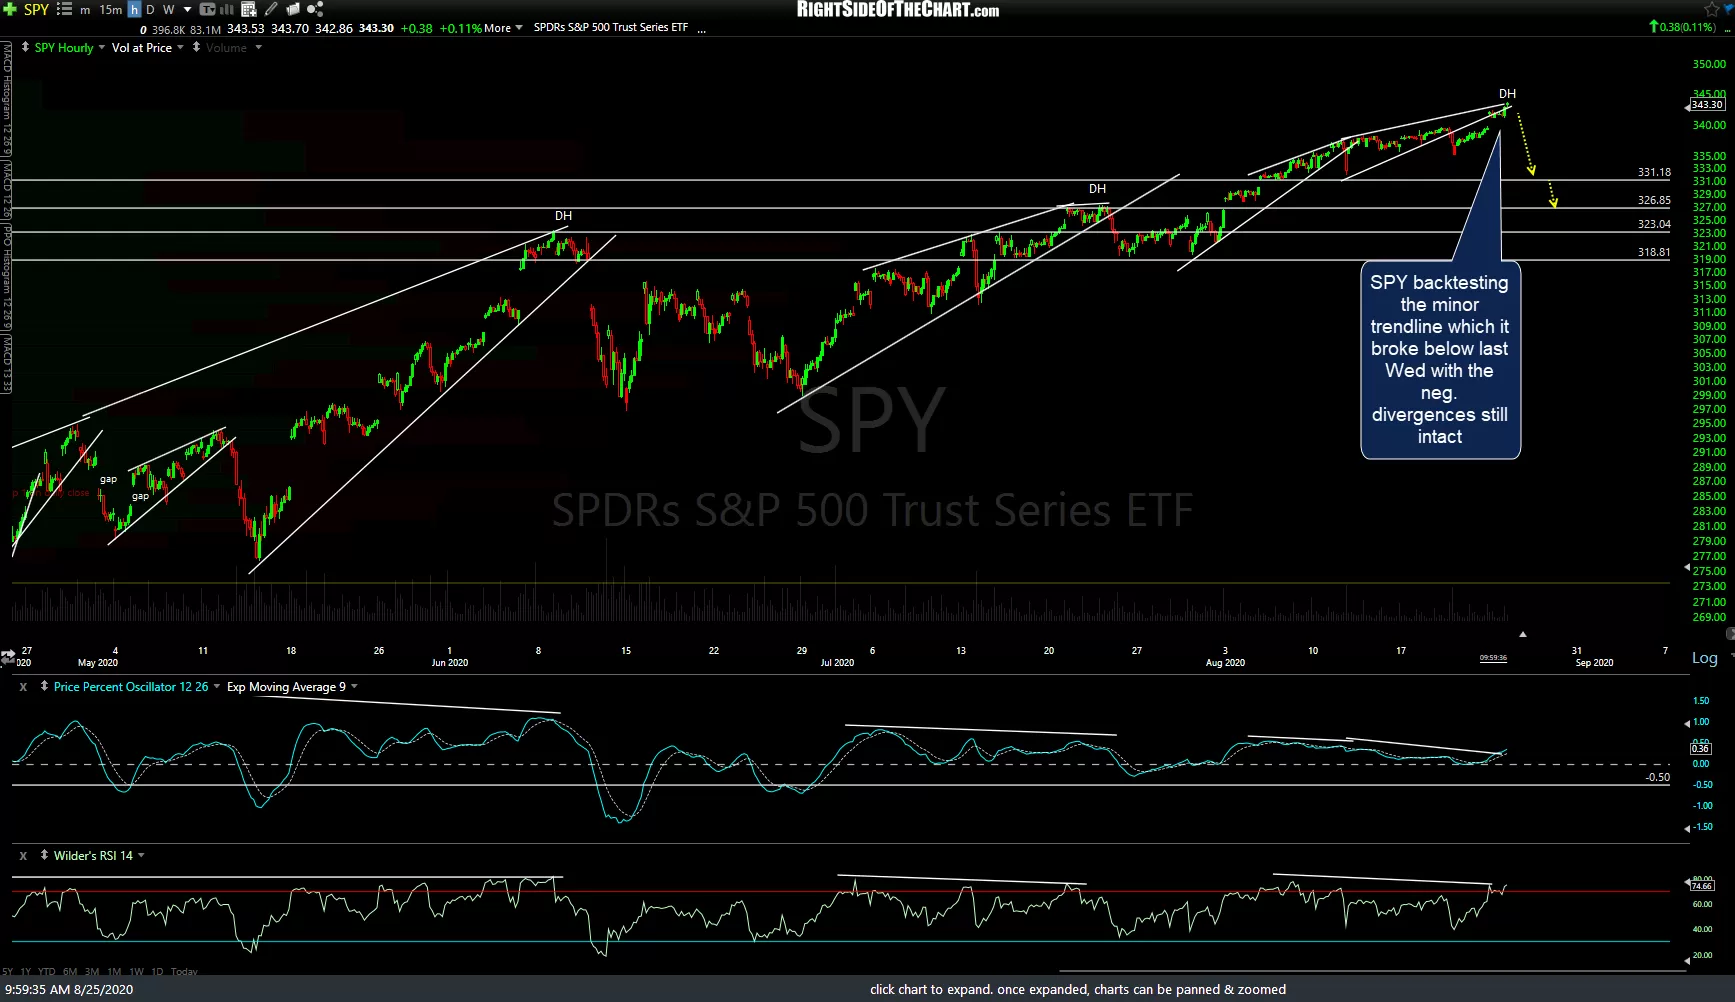
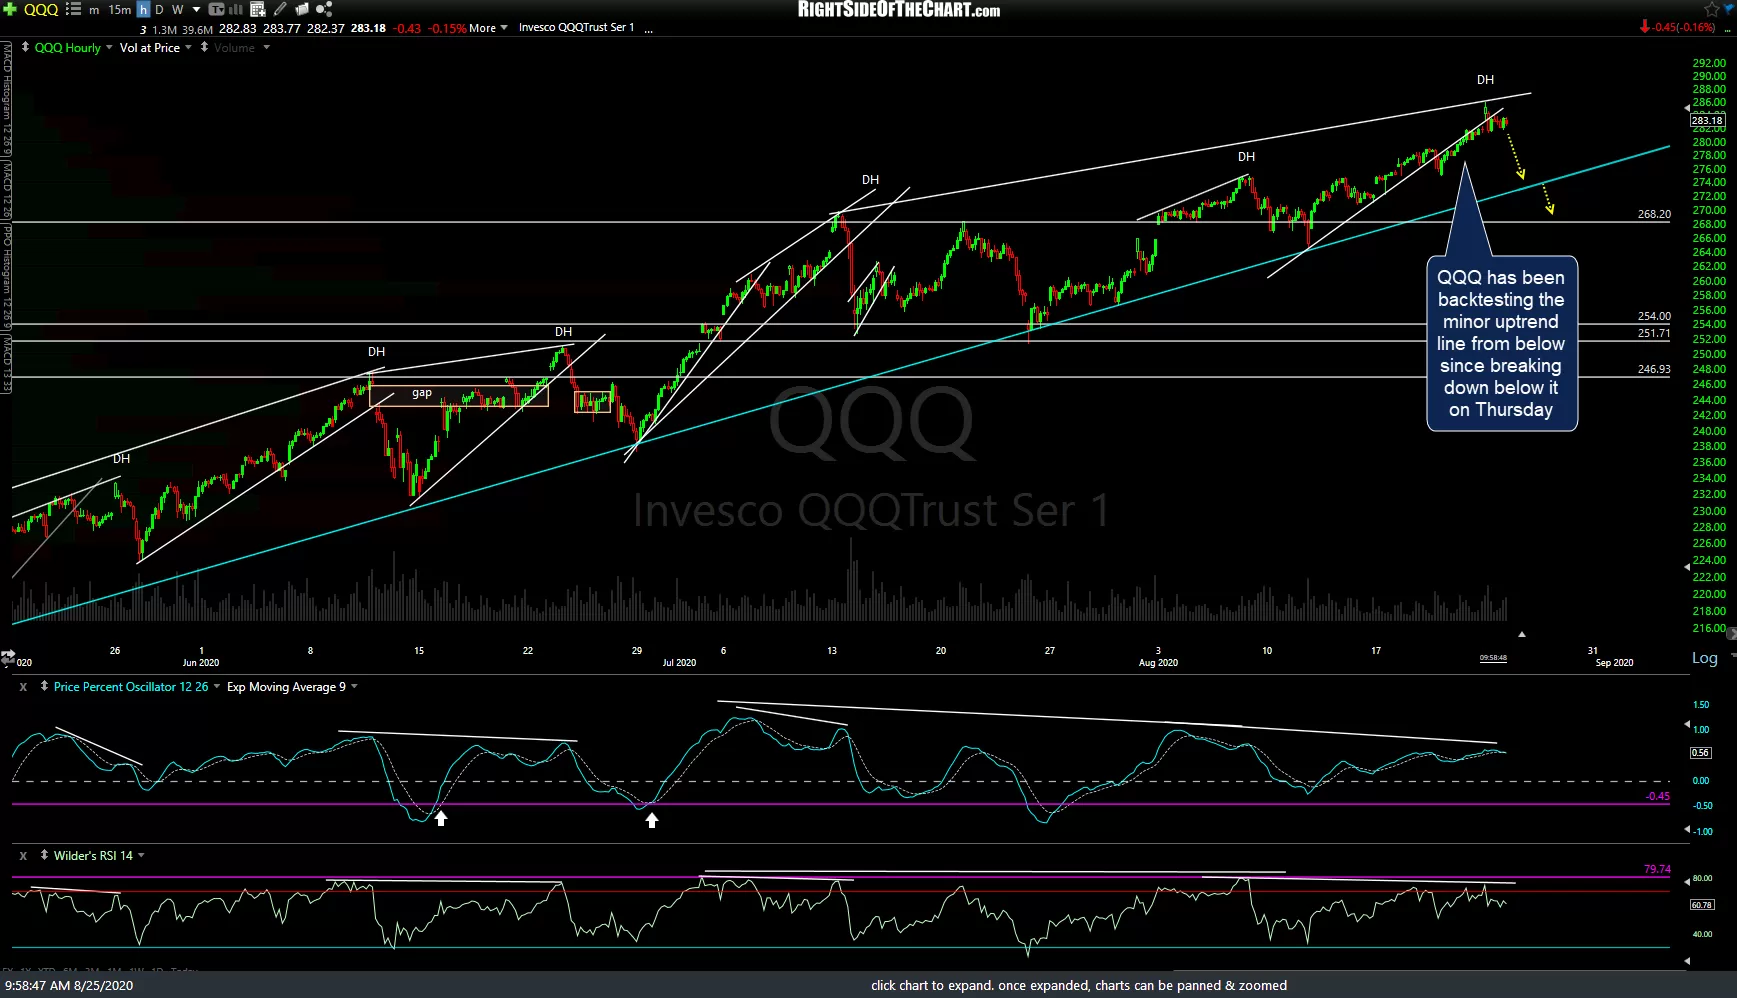
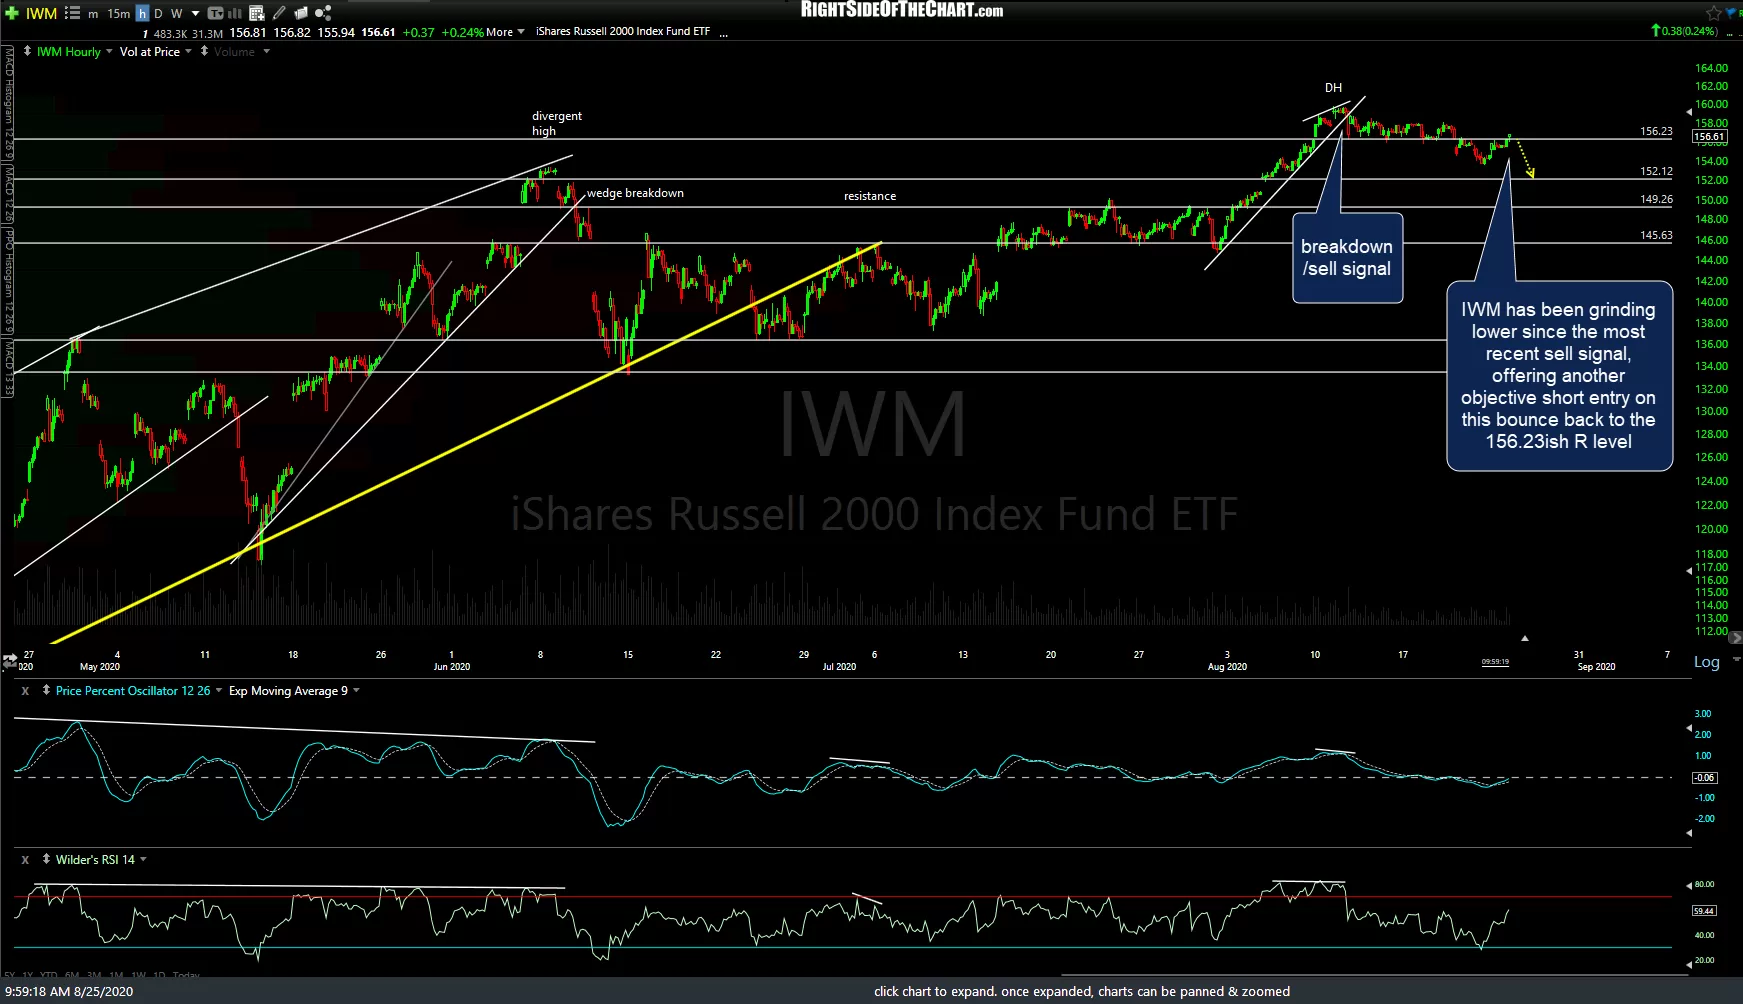
While we have yet to trigger any sell signals on the more significant daily time frames, the sell signals that were triggered on the 60-minute intraday charts last week remain intact for now with SPY, QQQ, & IWM all backtesting resistance levels (trendlines on SPY & QQQ, price resistance on IWM), thereby offering objective, albeit somewhat aggressive* short entries or add-ons.
-

- SPY 60m Aug 25th
-

- QQQ 60m Aug 25th
-
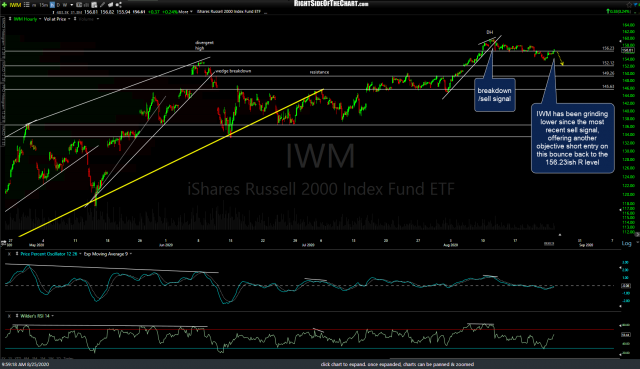
- IWM 60m Aug 25th
*Due to the unusual resiliency of the uptrend, going short any of the major stock indexes before any solid sell signals on the daily time frame or other evidence of a trend reversal carries a higher chance of failure & counter-trend trades should be considered aggressive at this time.