
Below are the 120-minute charts for /ES (S&P 500), /NQ (Nasdaq 100), and /RTY (Russell 2000) E-mini futures with some nearby support & resistance levels to watch/trade from. Note how the major stock indices (large-caps, i.e. $SPX & $NDX) have been stair-stepping lower since last week’s rejection & objective shorting opps off counter-trend rallied back to the key Fibonacci retracement levels + price resistance.

ES 120m Feb 16th
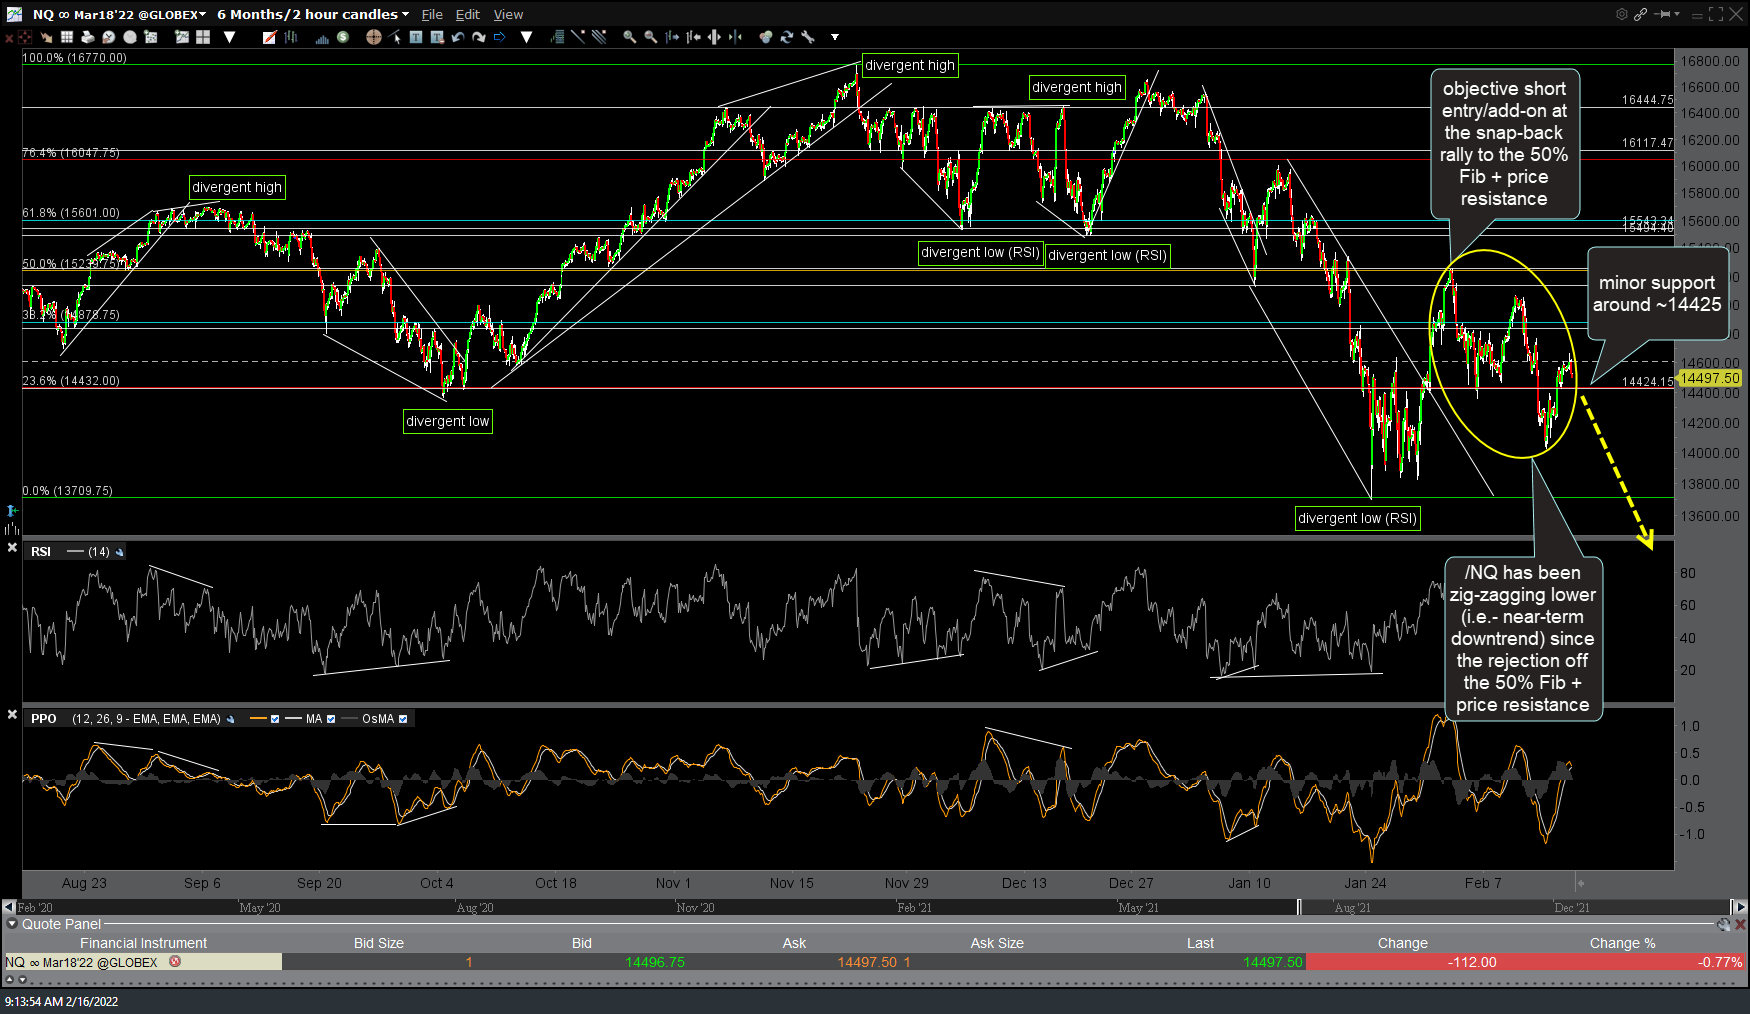
NQ 120m Feb 16th

RTY 120m Feb 16th