
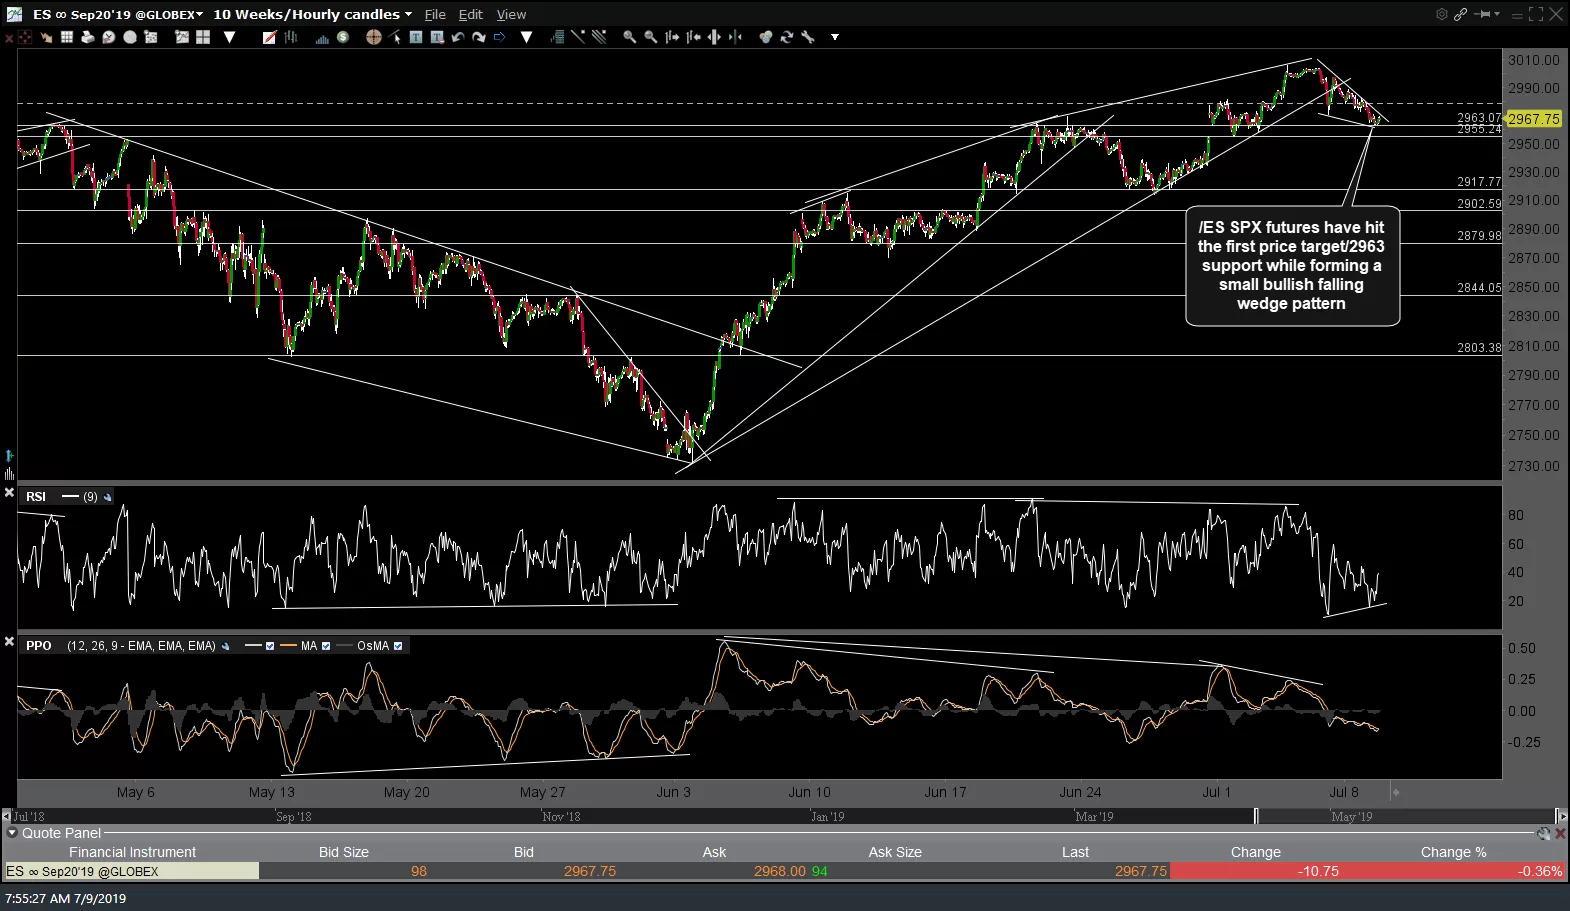
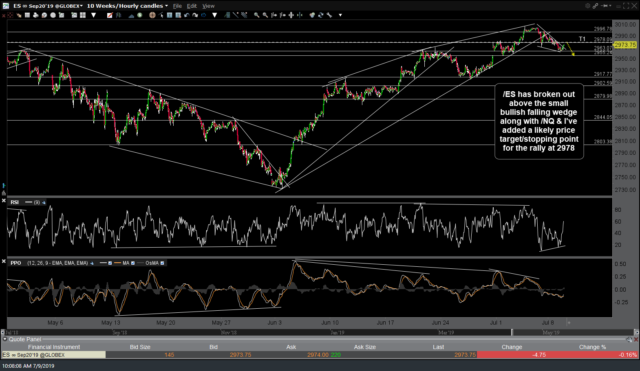
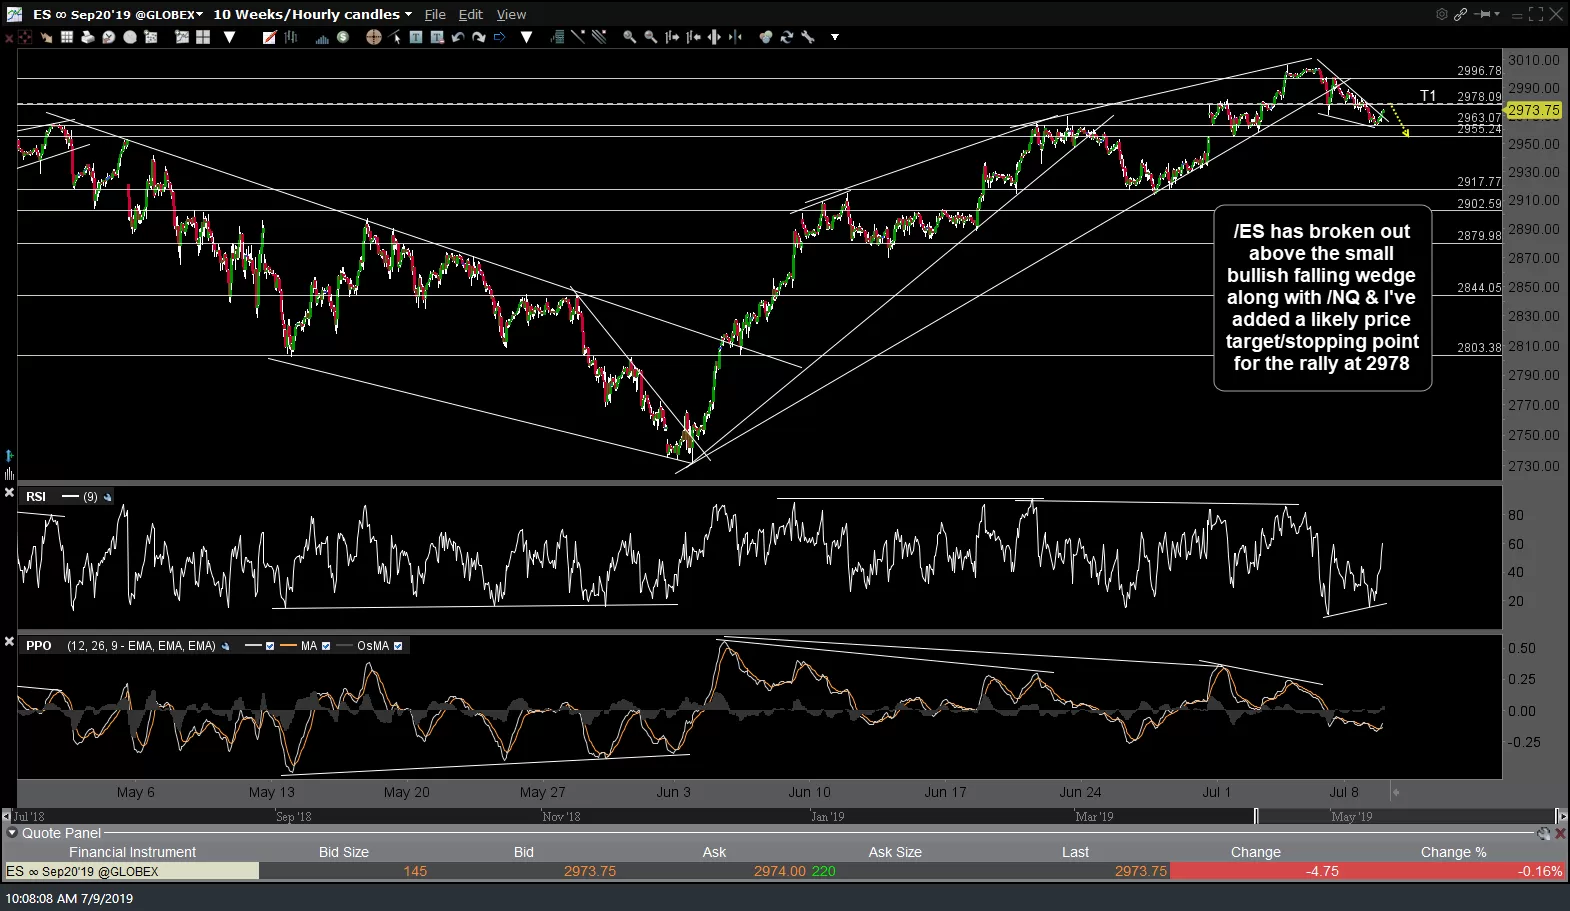
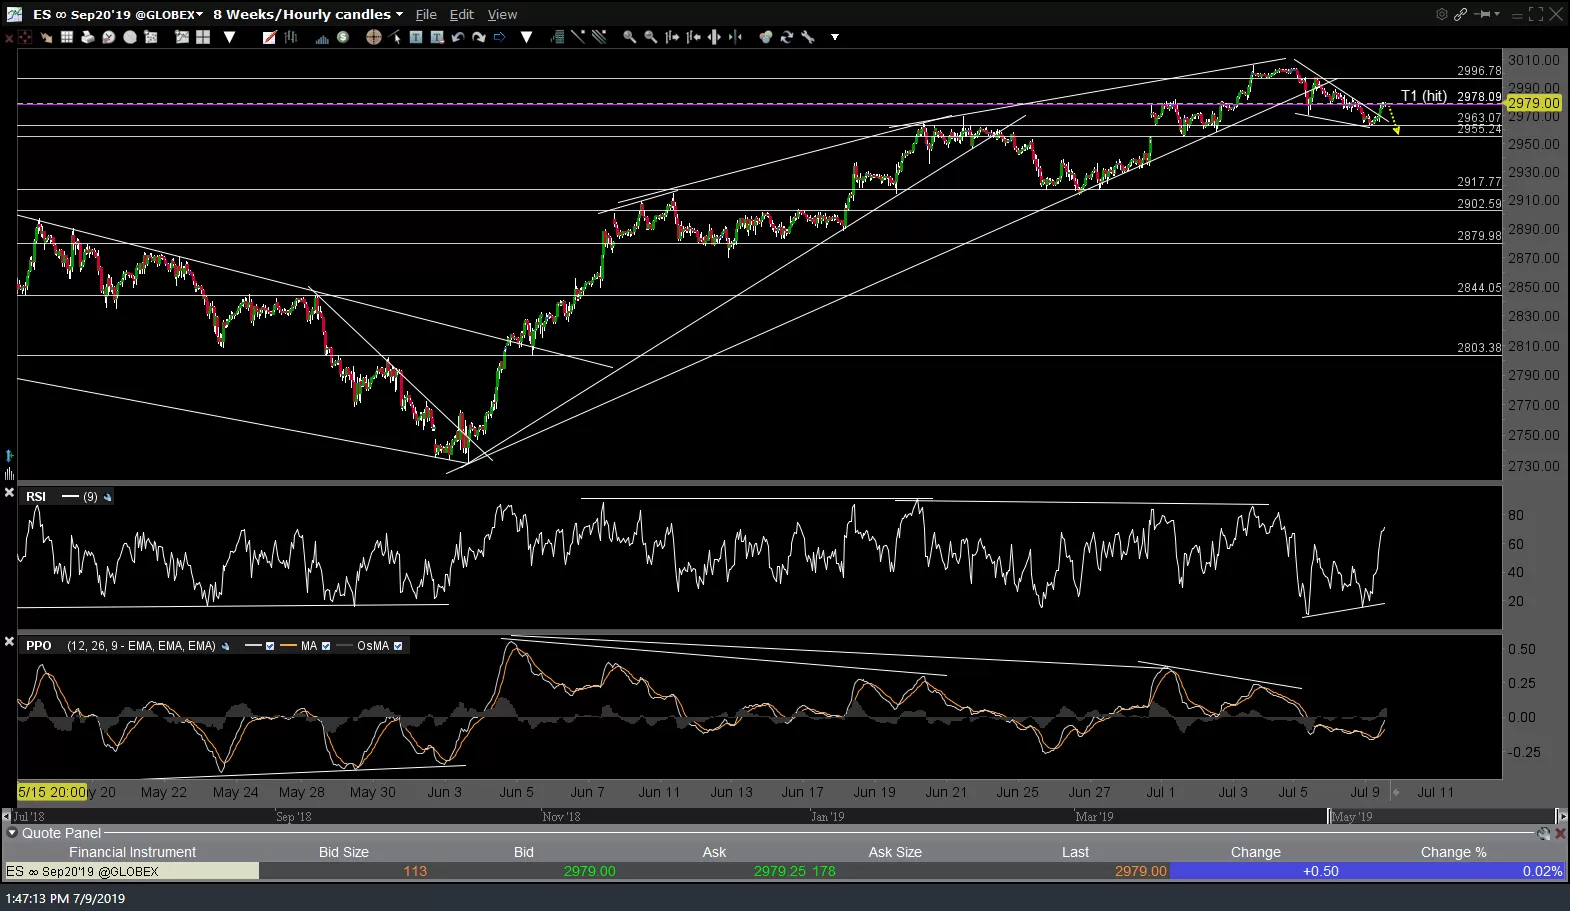
Both /ES (S&P 500) and /NQ (Nasdaq 100) are at the max. bounce targets posted earlier today following the breakouts of the small bullish falling wedge patterns. Those targets were T1 at 2978 on /ES & and T2 at 7844 on /NQ. Previous & updated 60-minute charts below. click first chart to expand, then click on right to advance to the next expanded chart.
-
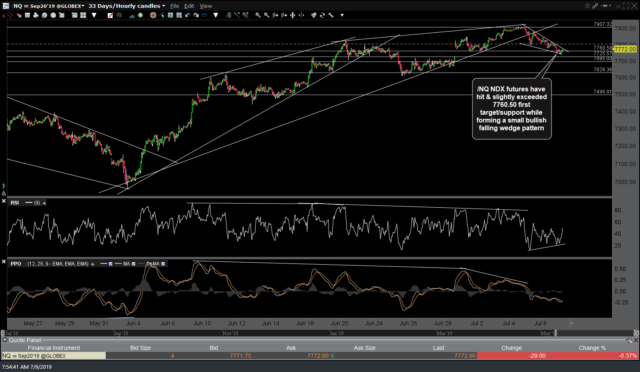
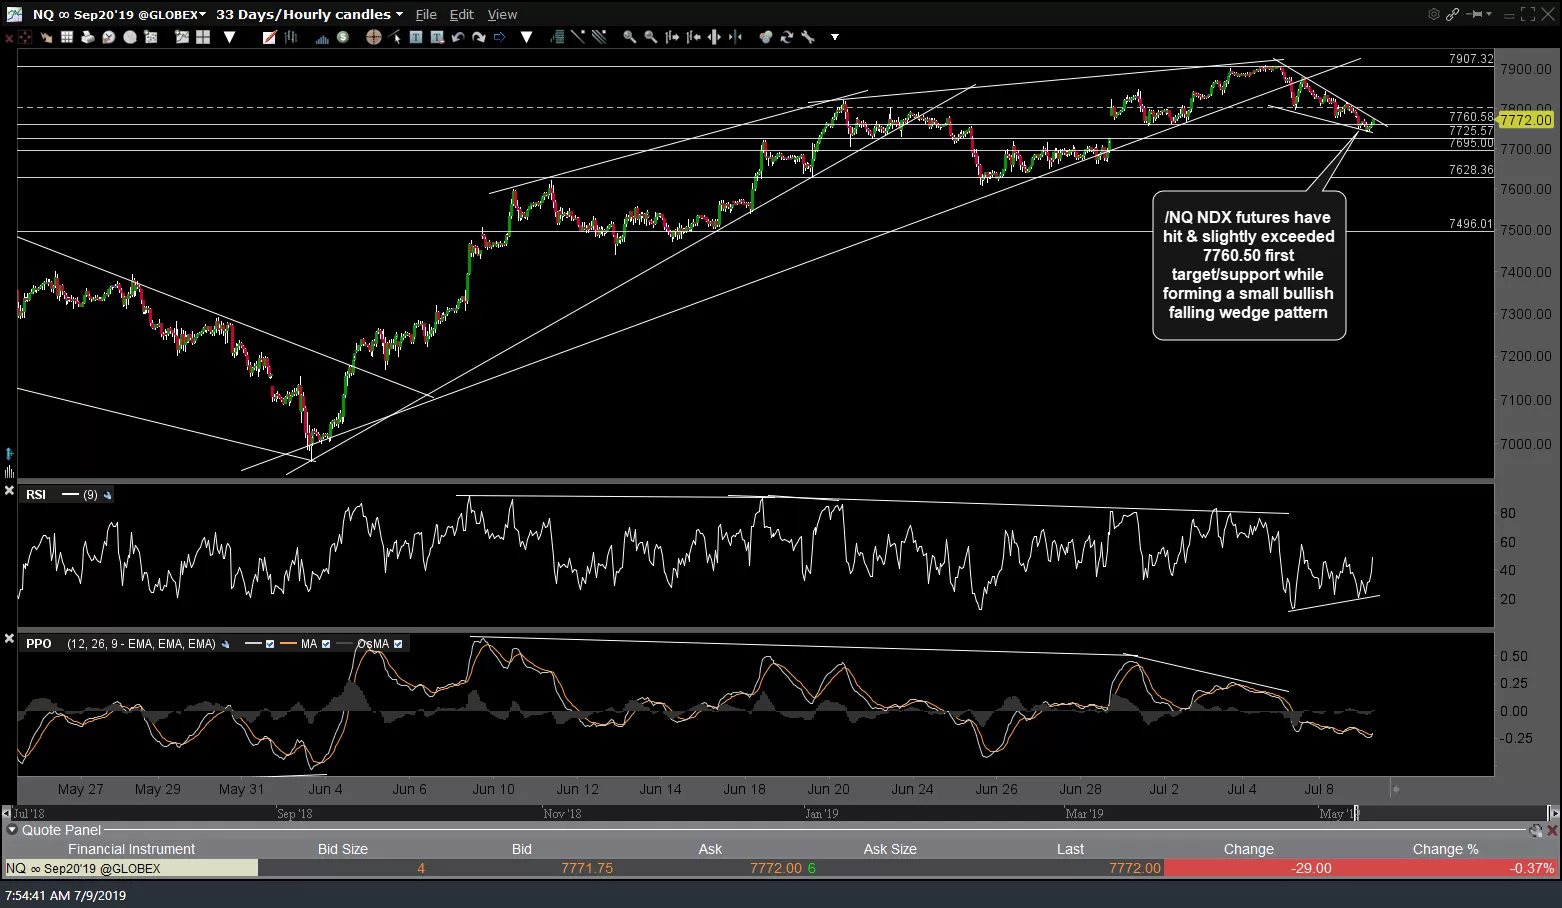
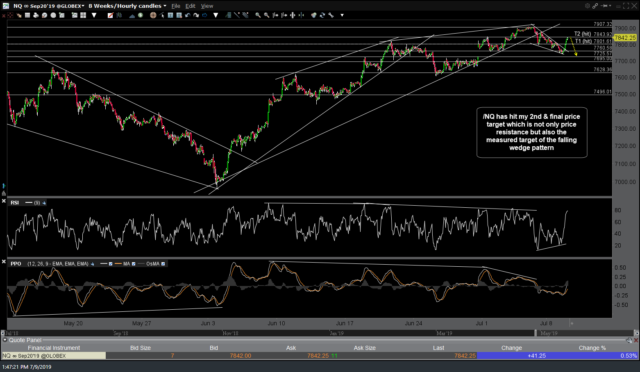
- NQ 60-min July 9th
-
- NQ 60-min 2 July 9th
-
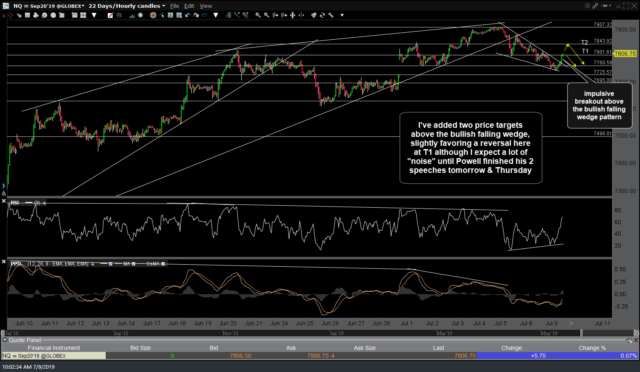
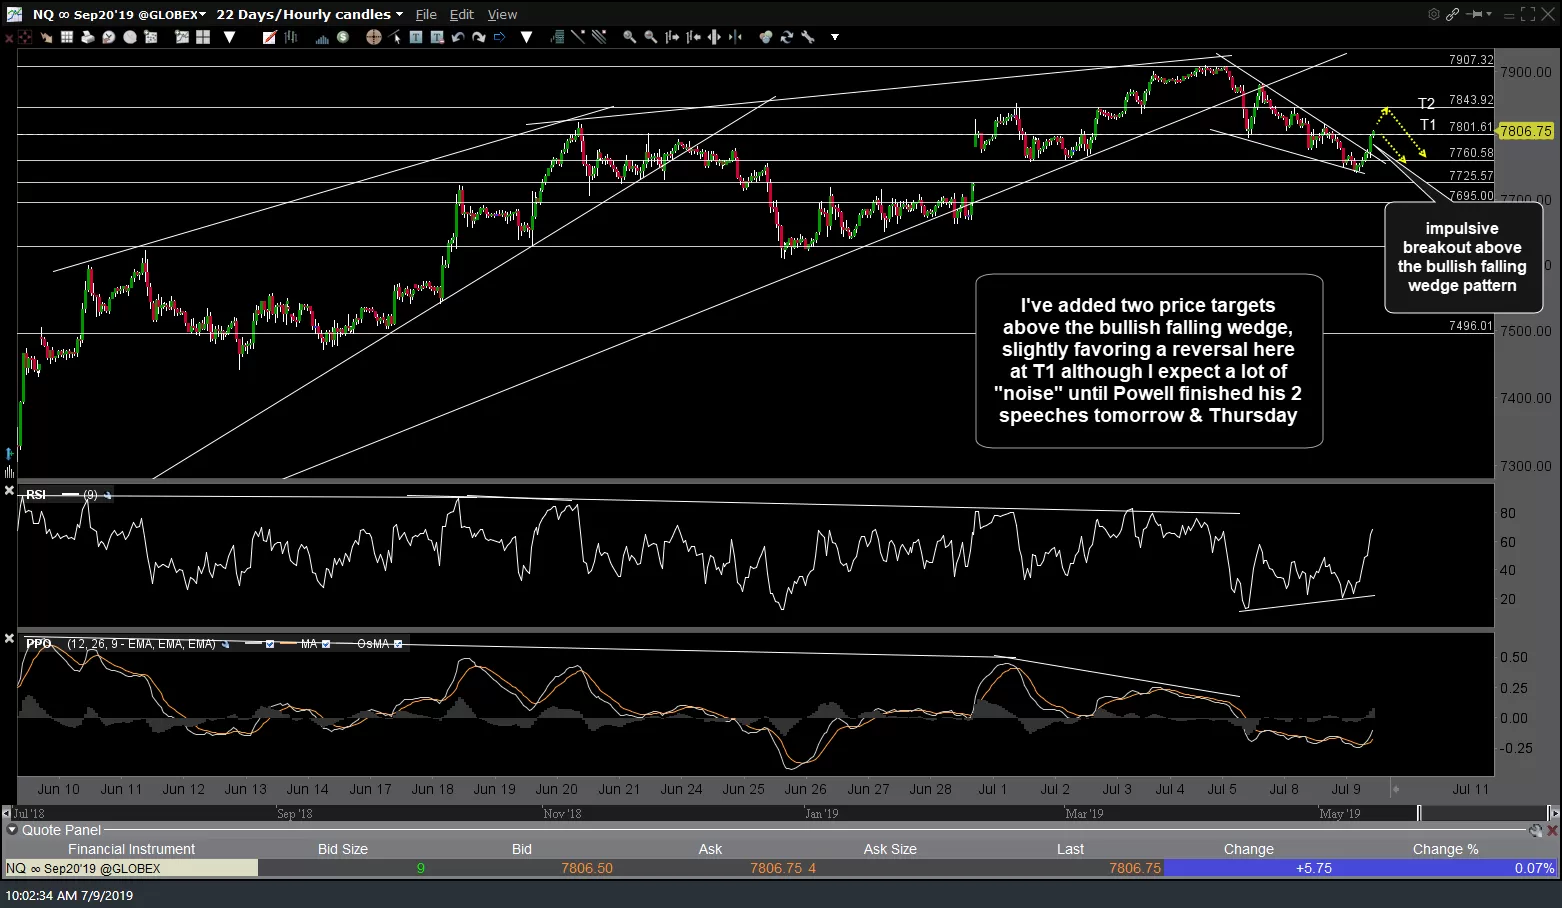
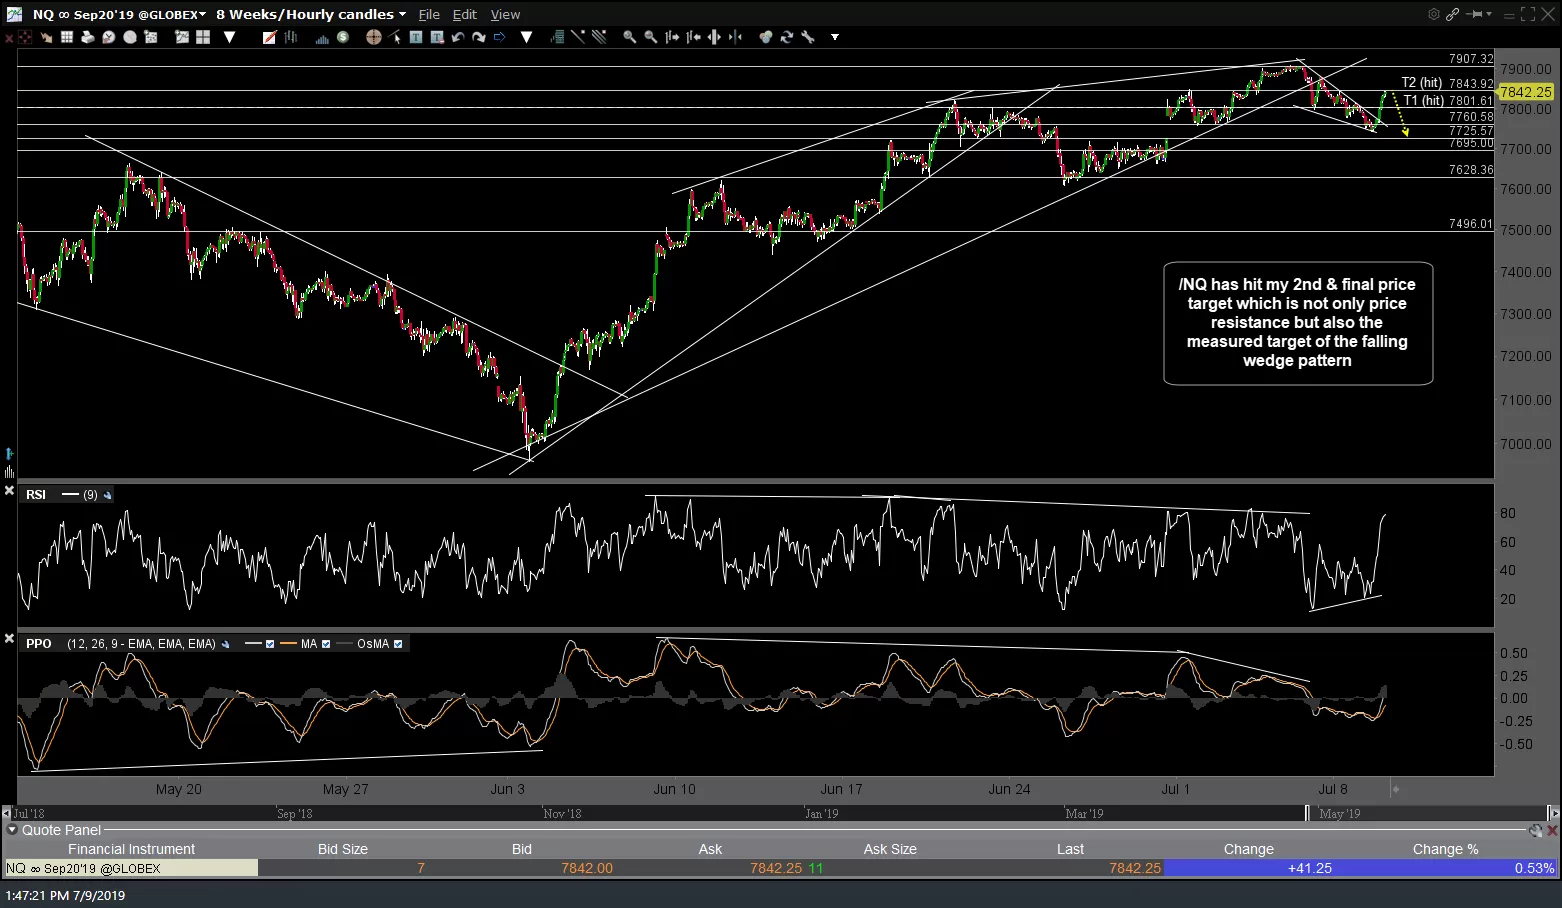
- NQ 60-min 3 July 9th
-
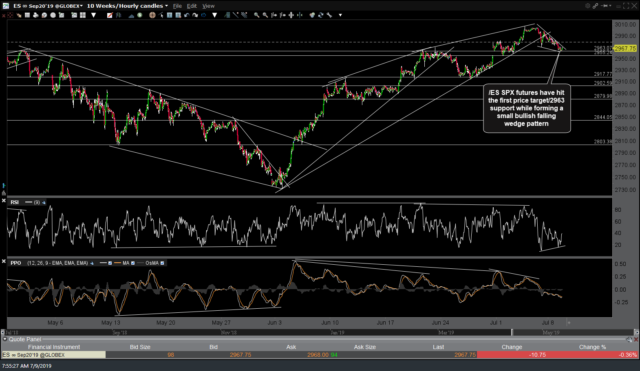
- ES 60-min July 9th
-
- ES 60-min 2 July 9th
-
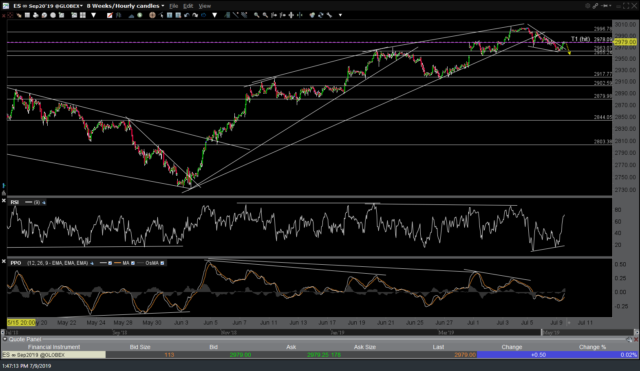
- ES 60-min 3 July 9th
The move following today’s earlier breakout above those falling wedges has also hit the approximate measured target for /NQ (i.e.- the distance widest part of the wedge added to the point where prices broke out above the pattern). As such, I believe this is an objective level to either book profits on any longs taken at the breakout and/or reverse to a short position for either a day trade fade into the close and/or a swing short position targeting at least the 7725.50ish level.
-

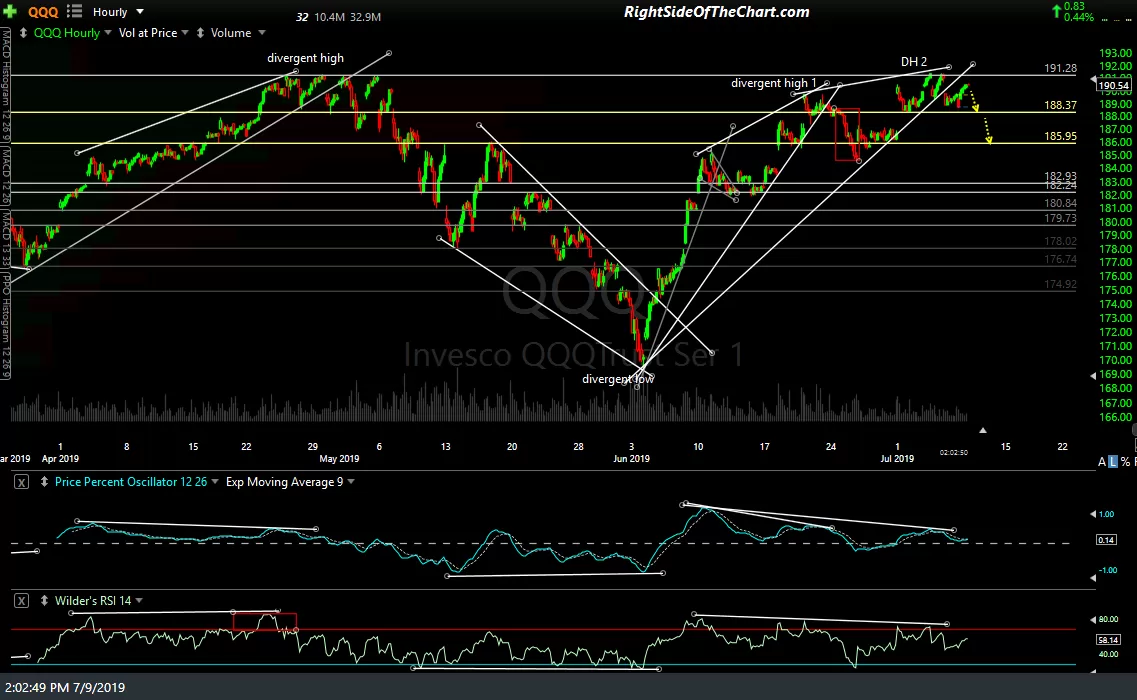
- QQQ 60-min 2 July 9th
-
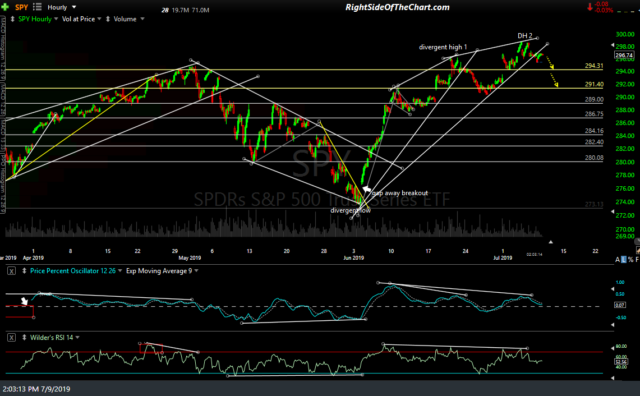
- SPY 60-min 2 July 9th
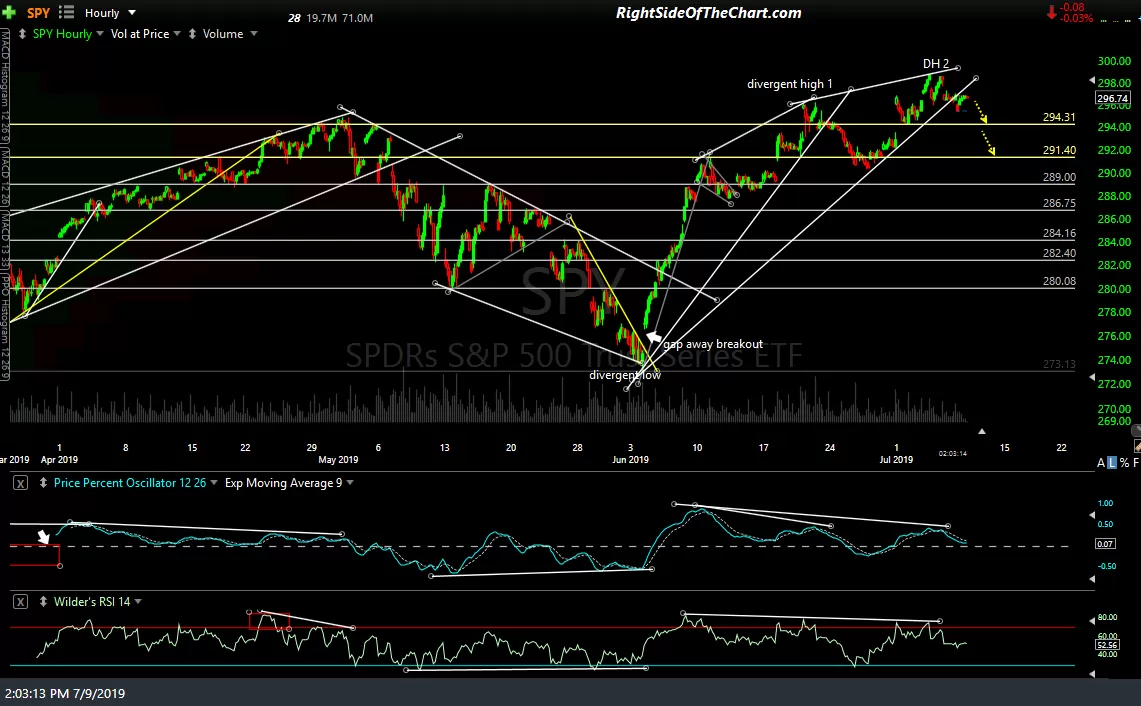
I’m only passing these along as unofficial trade ideas as the speaking events scheduled for Fed Chairman Jerome Powell both tomorrow & Thursday have the potential to spike volatility in the markets & override the near-term technicals. For ETF traders, the 60-minute charts of QQQ & SPY above provide some potential near-term swing targets (yellow lines) as well.