
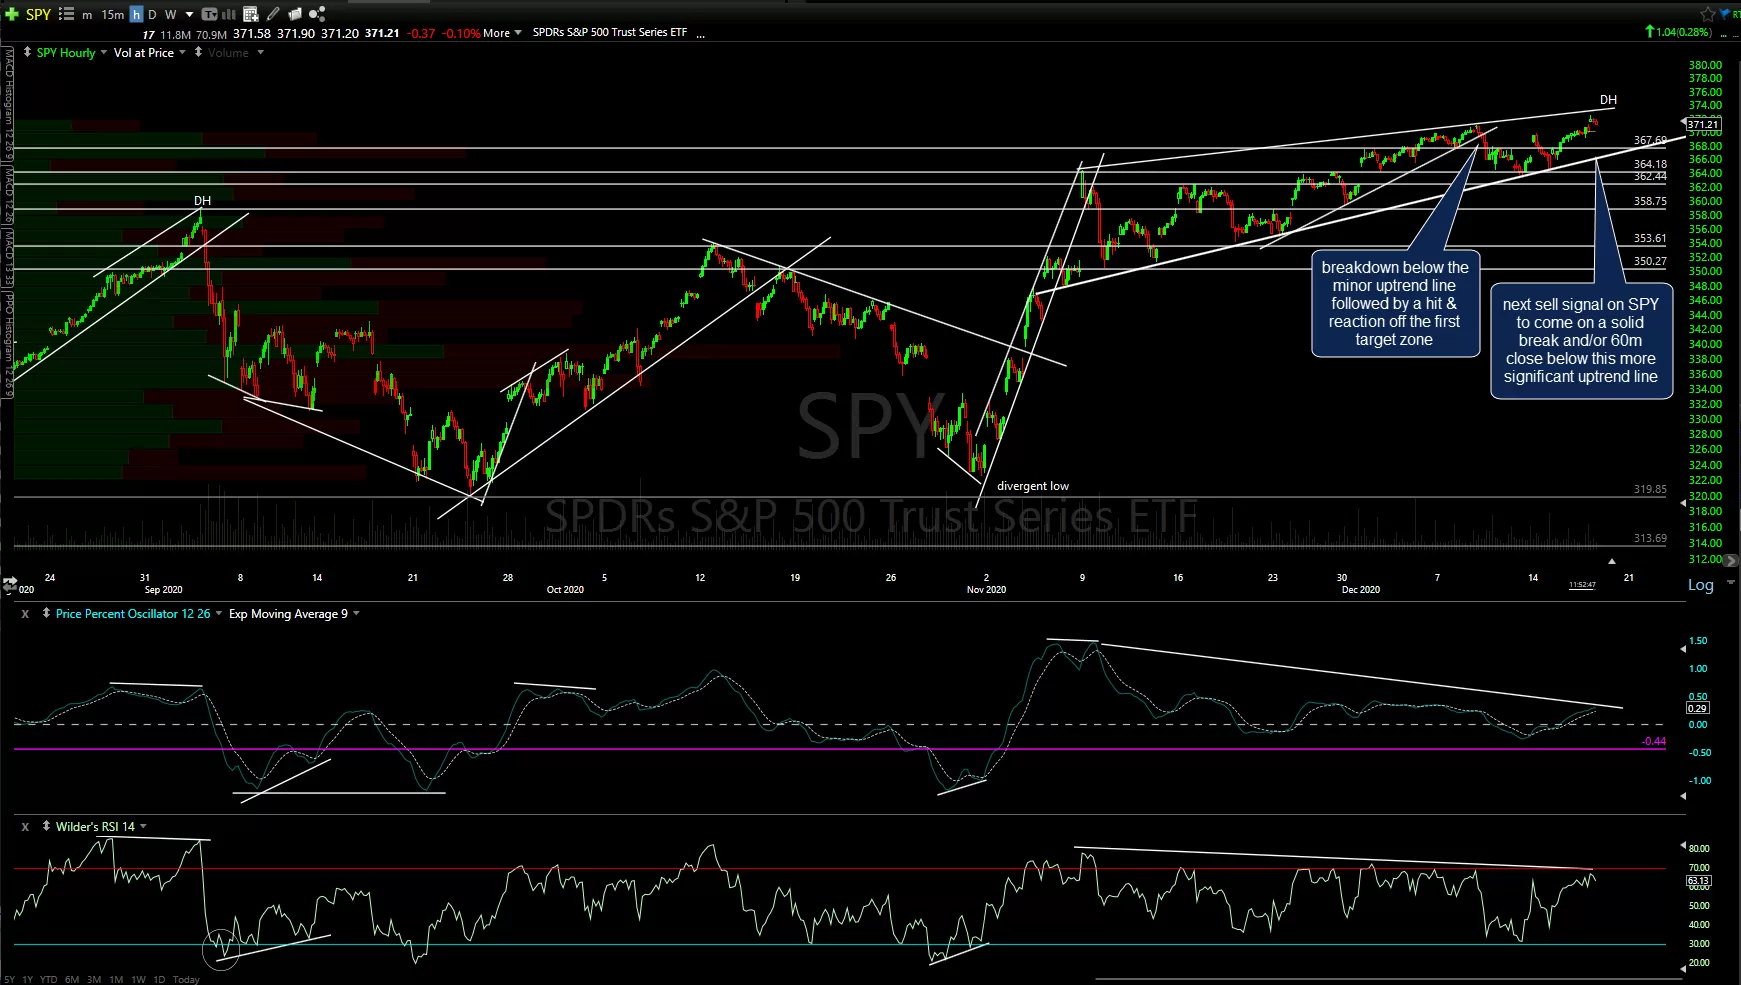
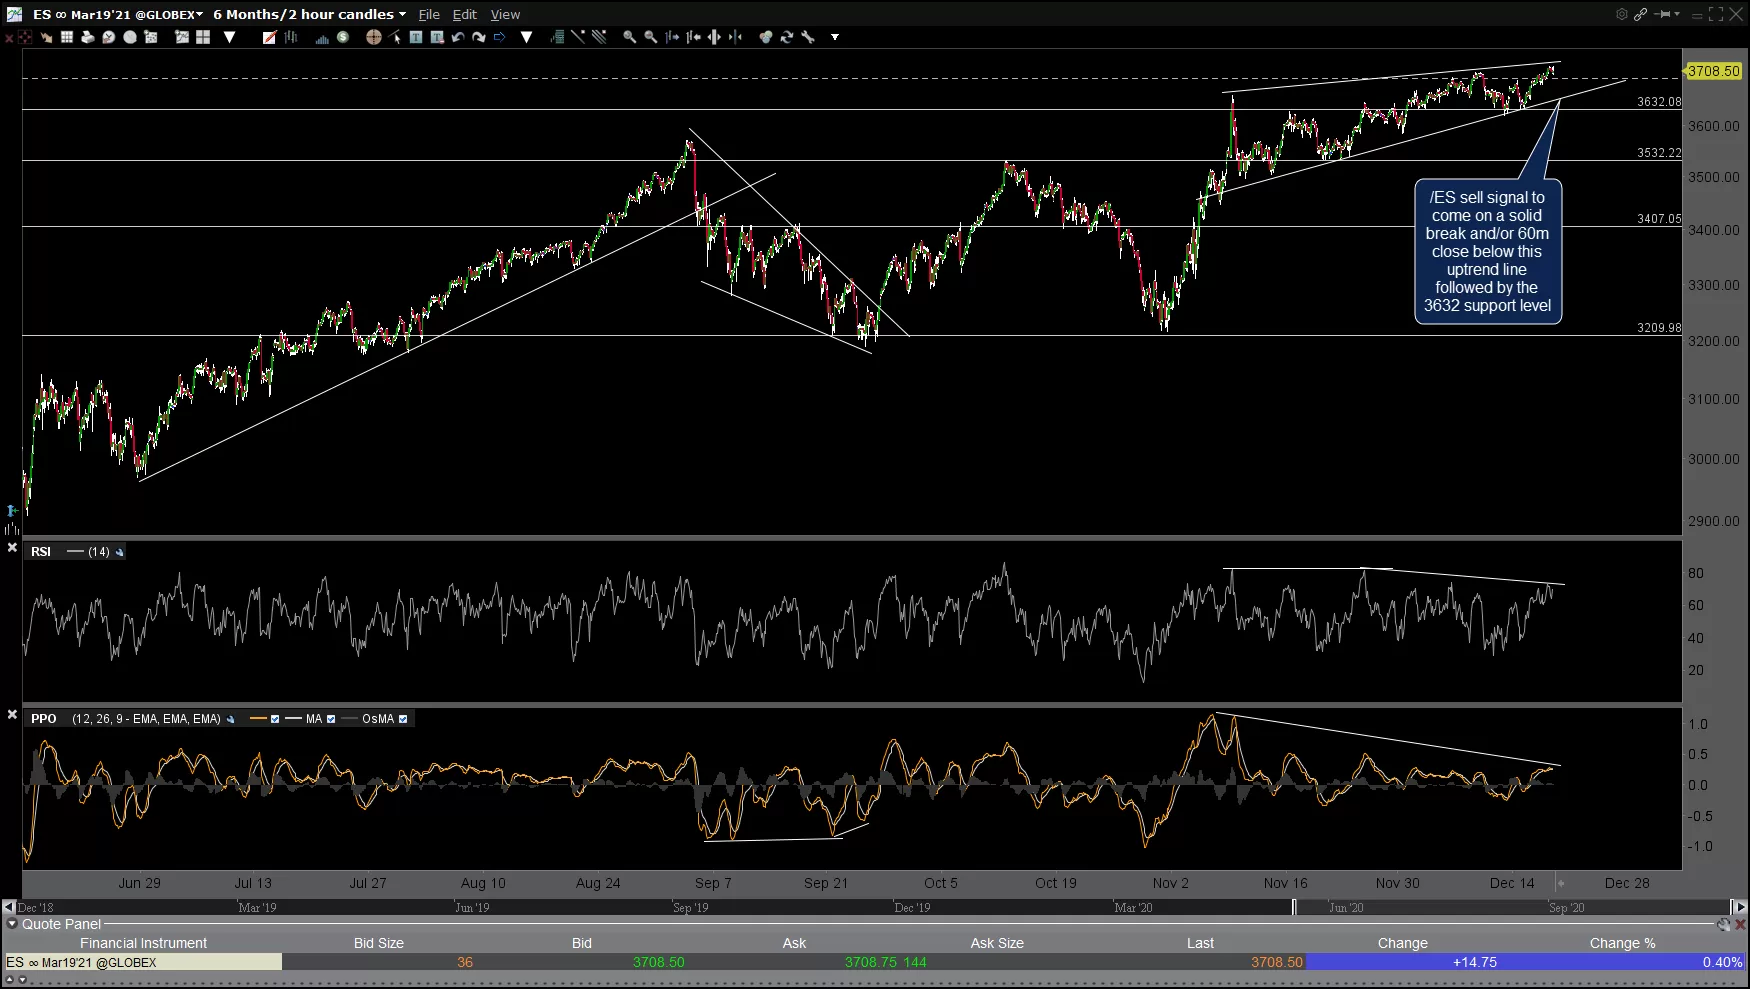
The charts below are 60-minute charts of the major stock index ETFs & futures, highlighting some key uptrend lines & price support levels/potential price targets along with levels that would trigger the next sell signals if/when taken out.
-
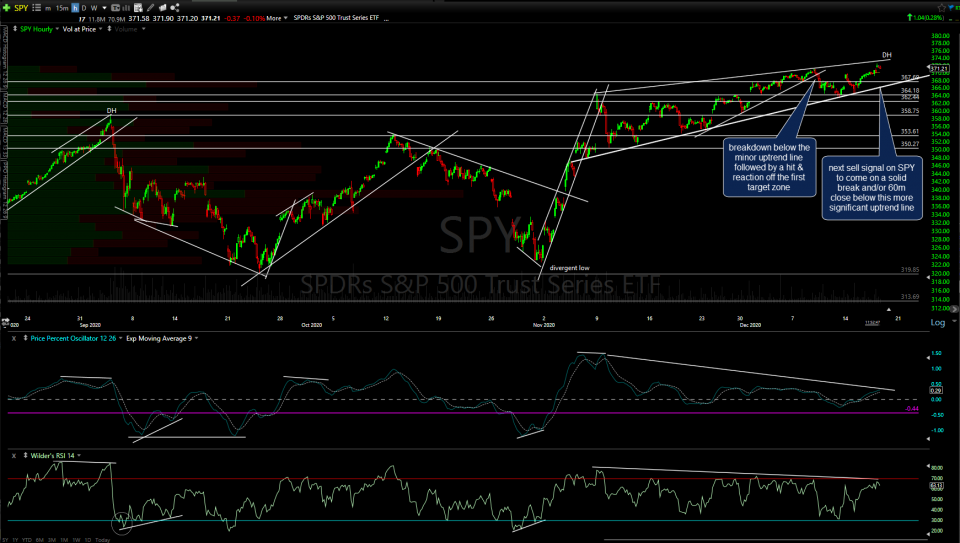
- SPY 60m Dec 17th
-
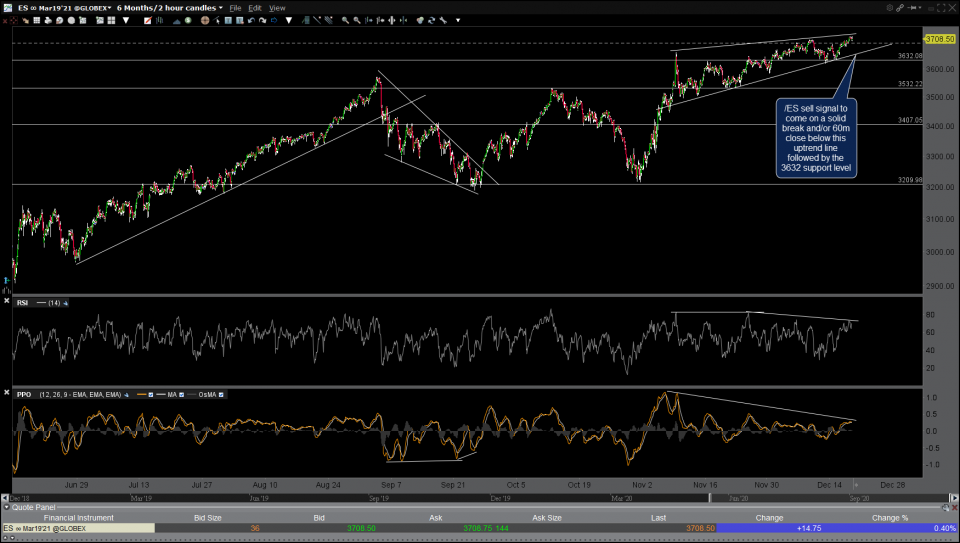
- ES 60m Dec 17th
-
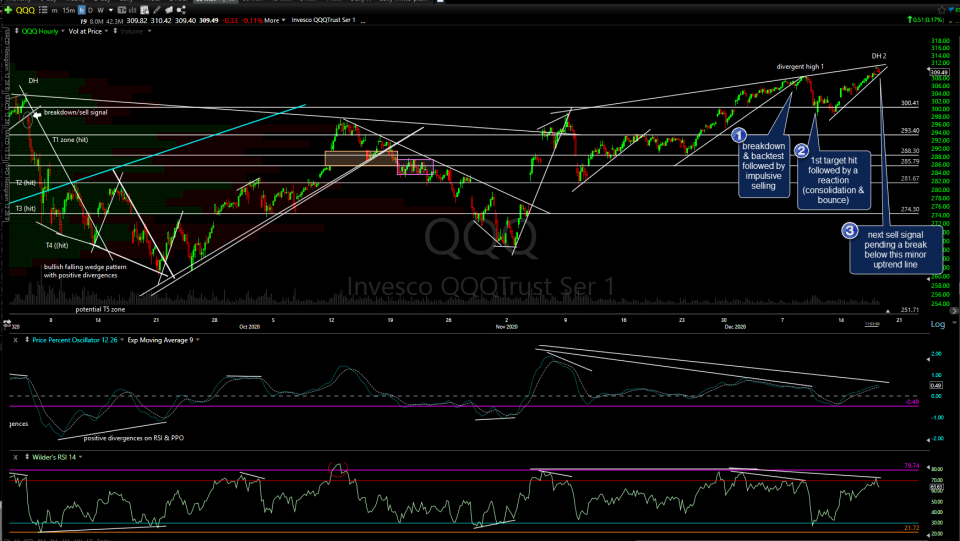
- QQQ 60m Dec 17th
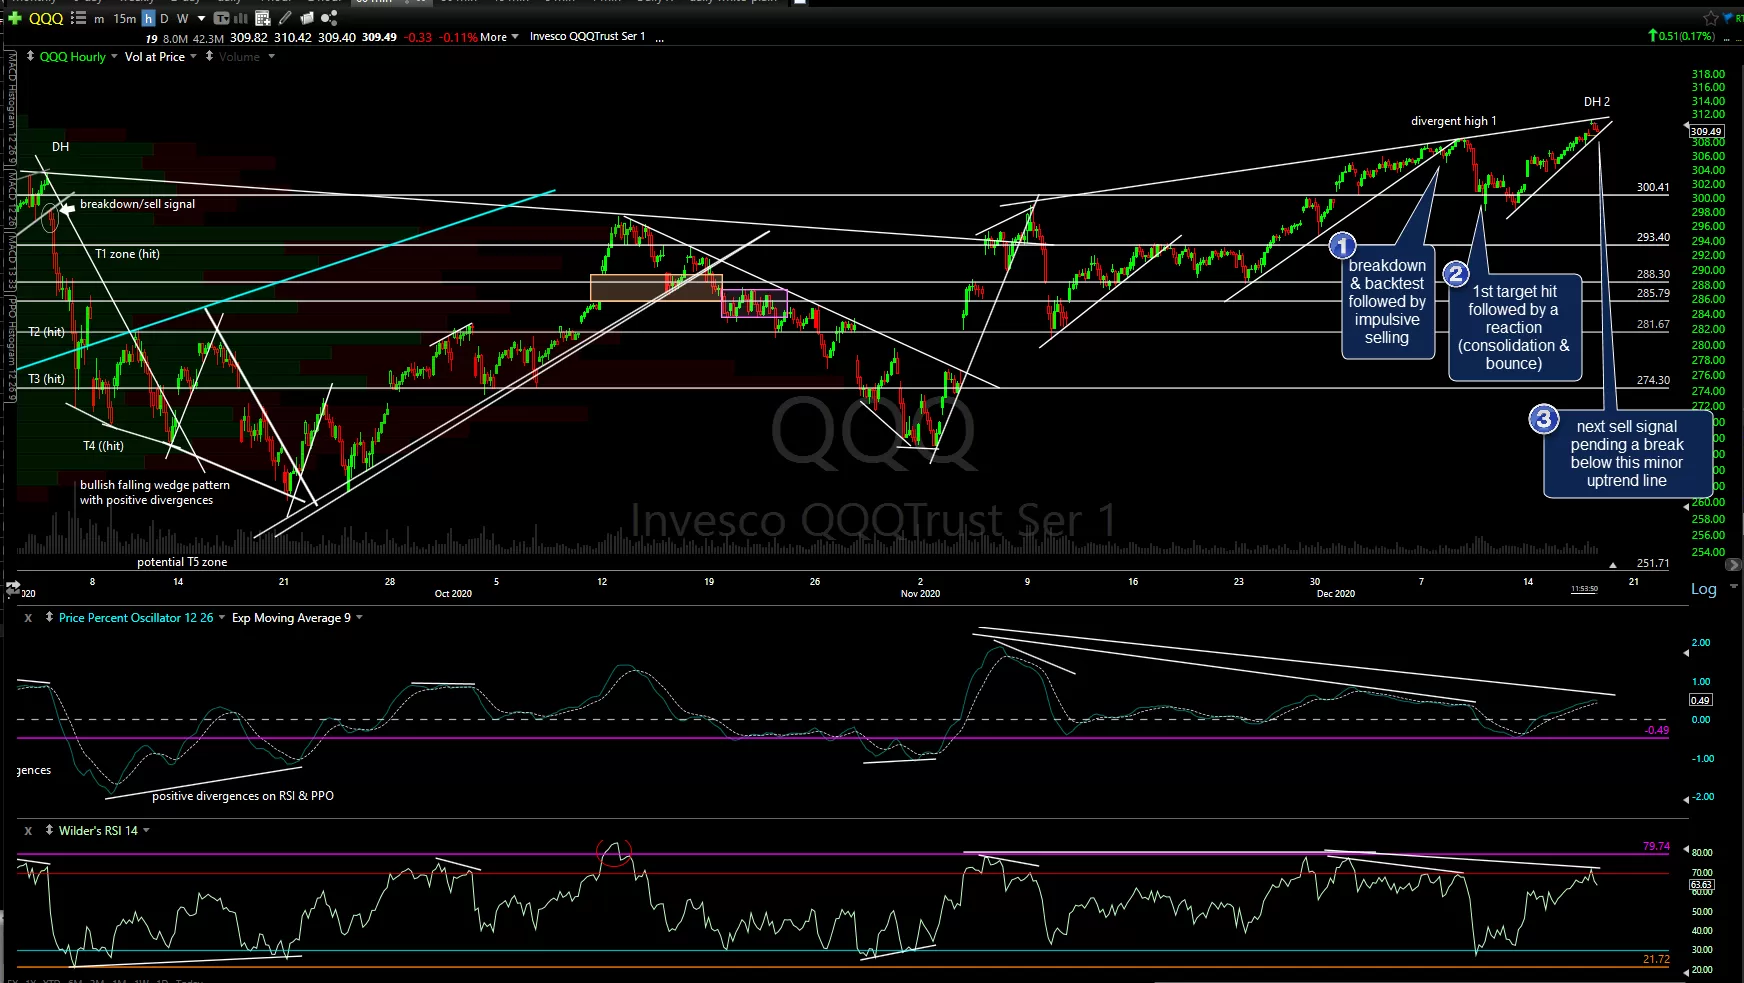
-
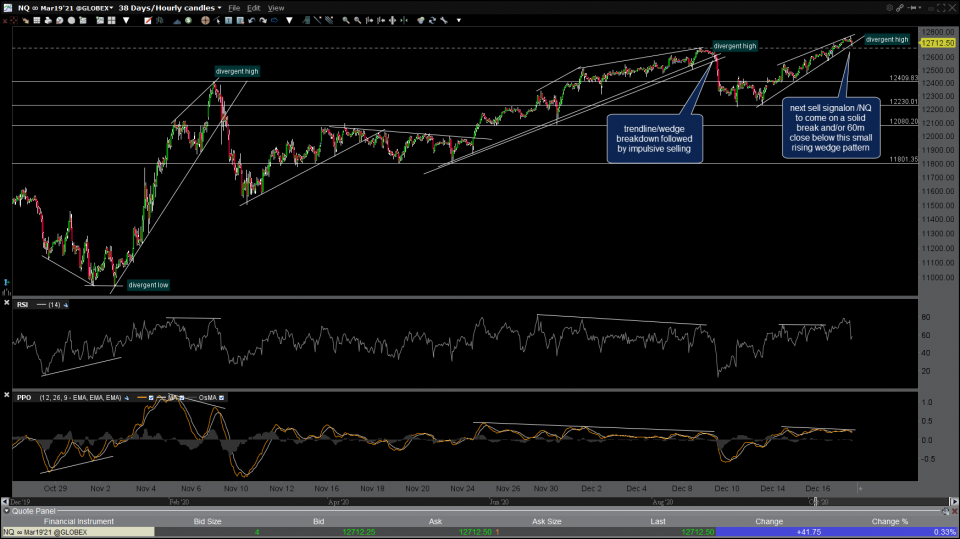
- NQ 60m Dec 17th
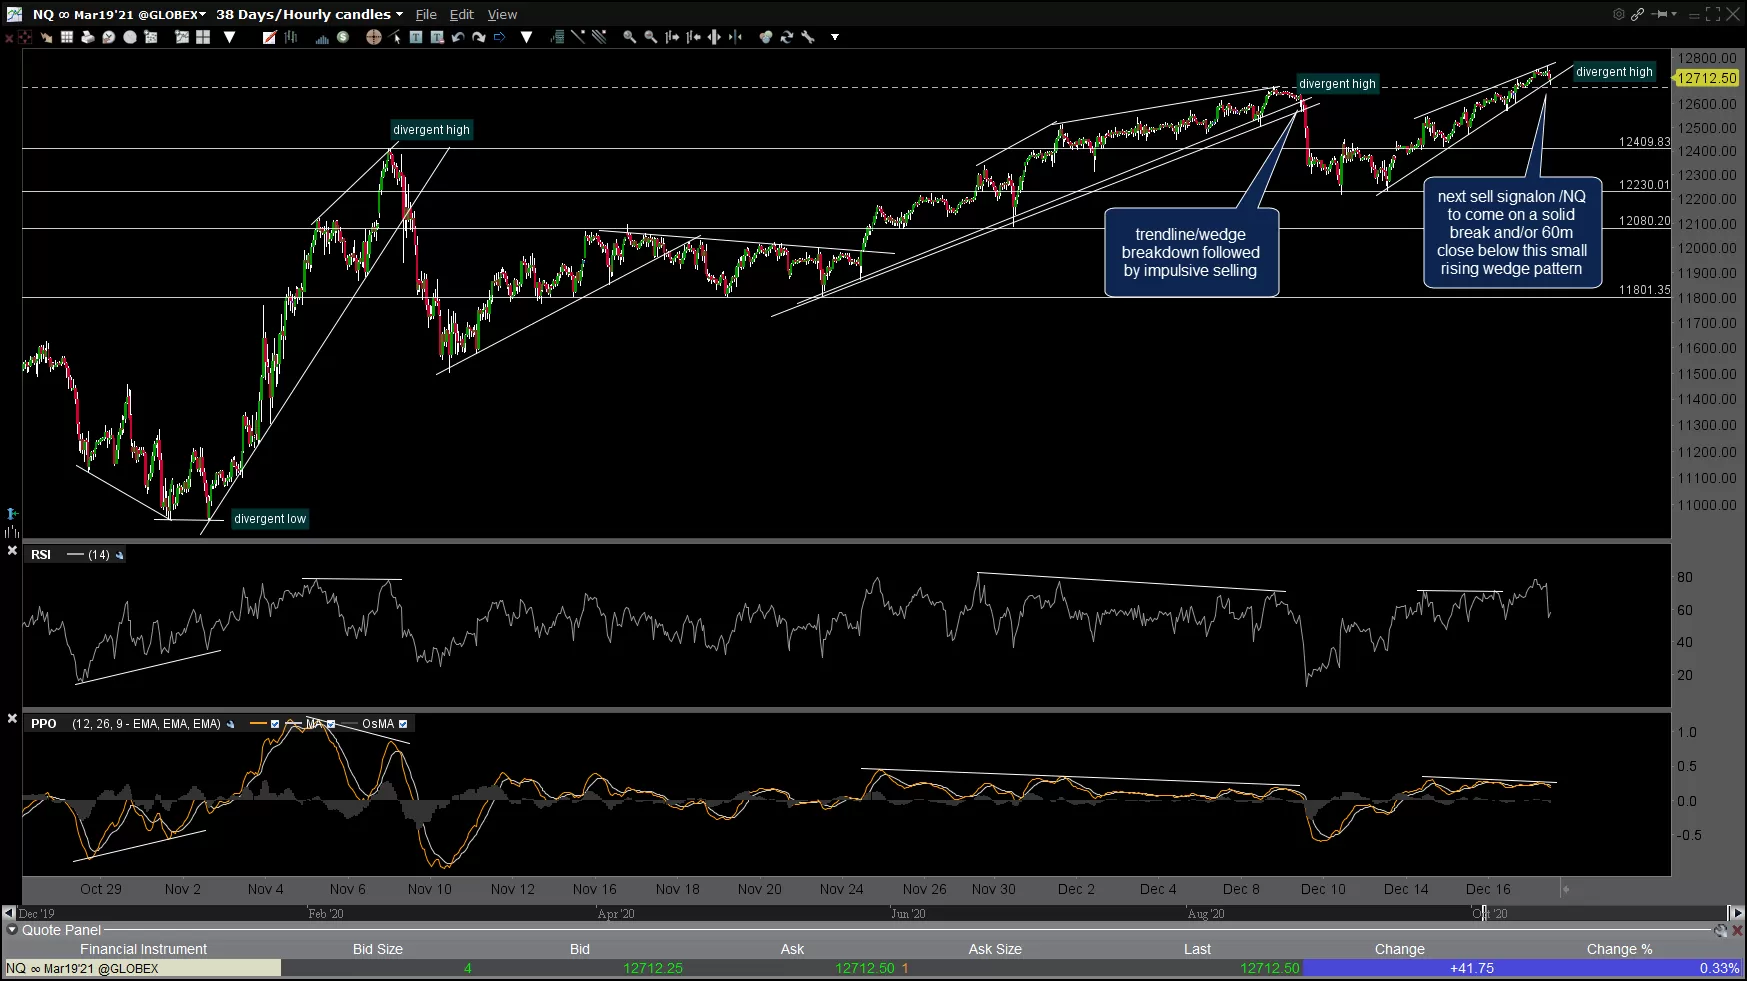
-
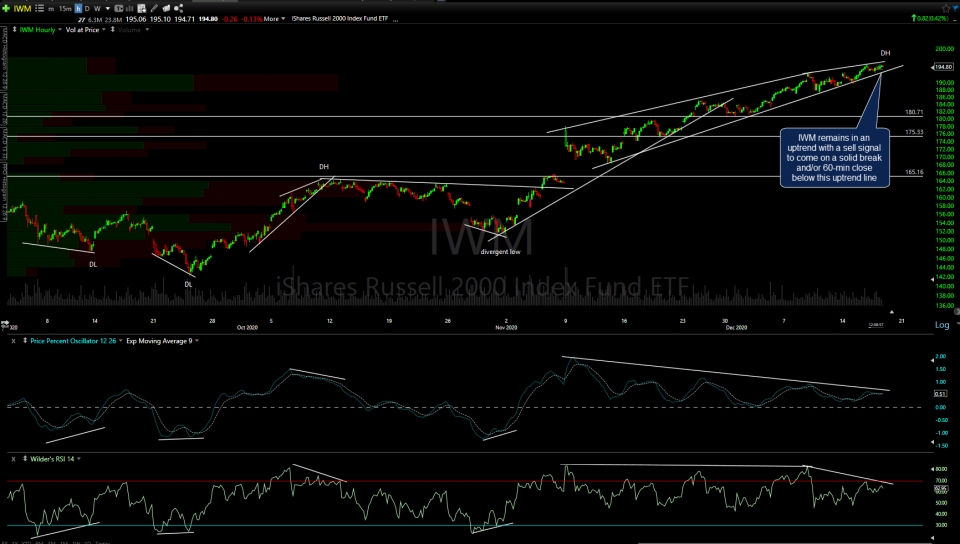
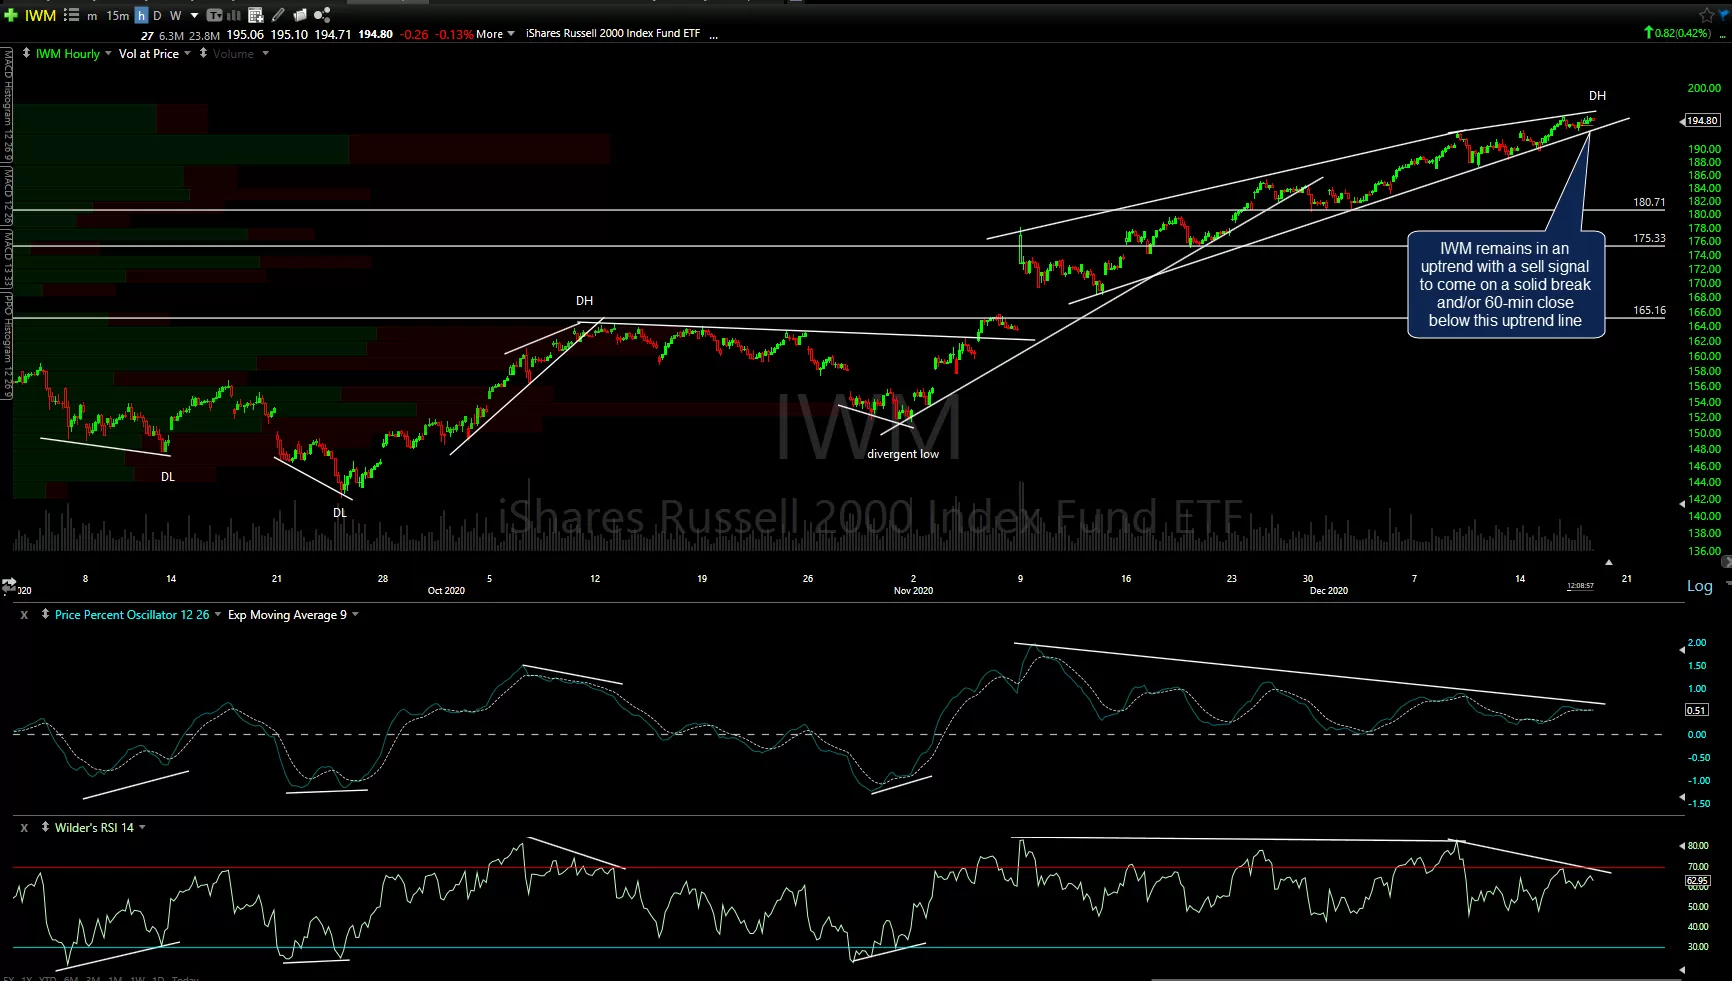
- IWM 60m Dec 17th
-
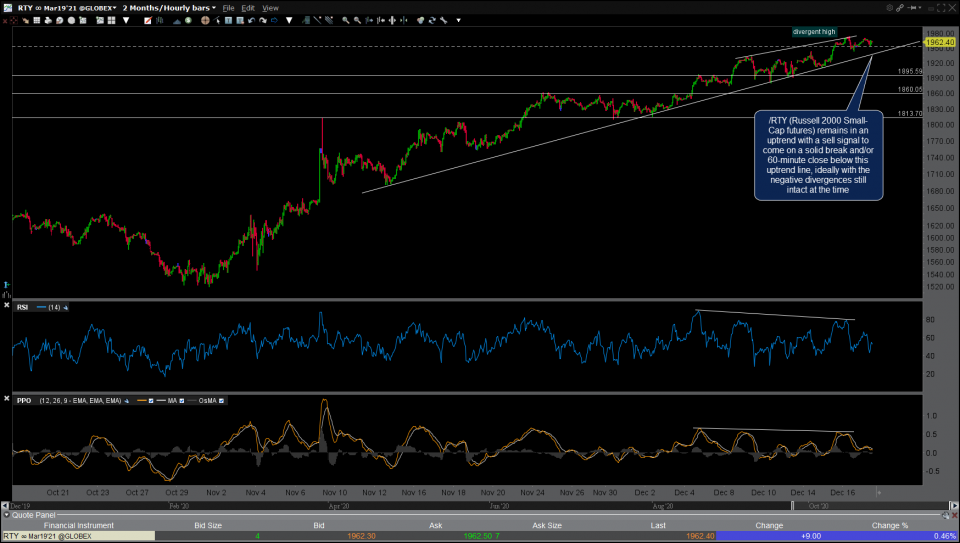
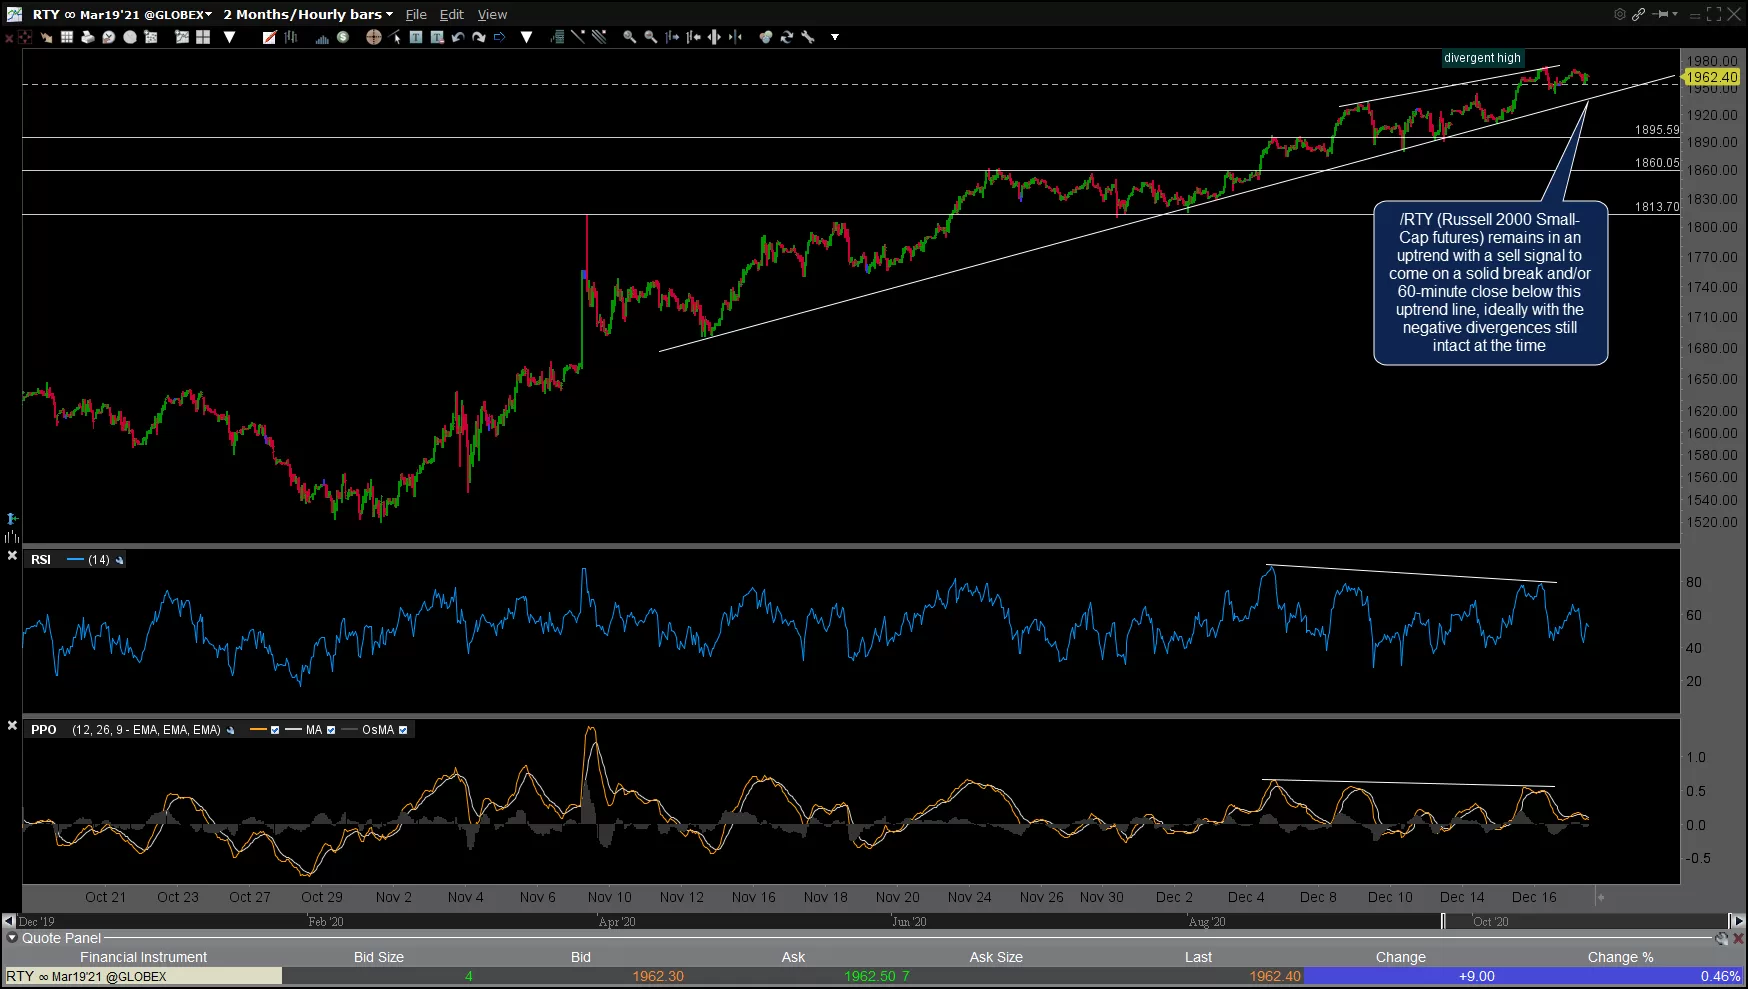
- RTY 60m Dec 17th
Click on the first chart above to expand & then click on the arrow to advance to the next expanded chart. Once expanded, the charts can be panned & zoomed for additional detail. Charts posted in a gallery format, as below, will not appear on the email notifications but may be viewed by visiting rsotc.com (short url).