Here are the 60-minute charts of the major stock index ETFs & E-mini futures with nearby support & resistance levels. Click on the first chart to expand, then click on the arrow to advance to the next chart. Once expanded, charts can be panned & zoomed. Gallery charts, as below, will not appear on the new post email notifications.
-
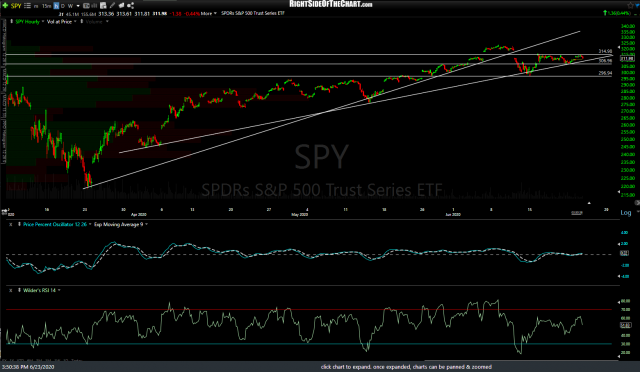
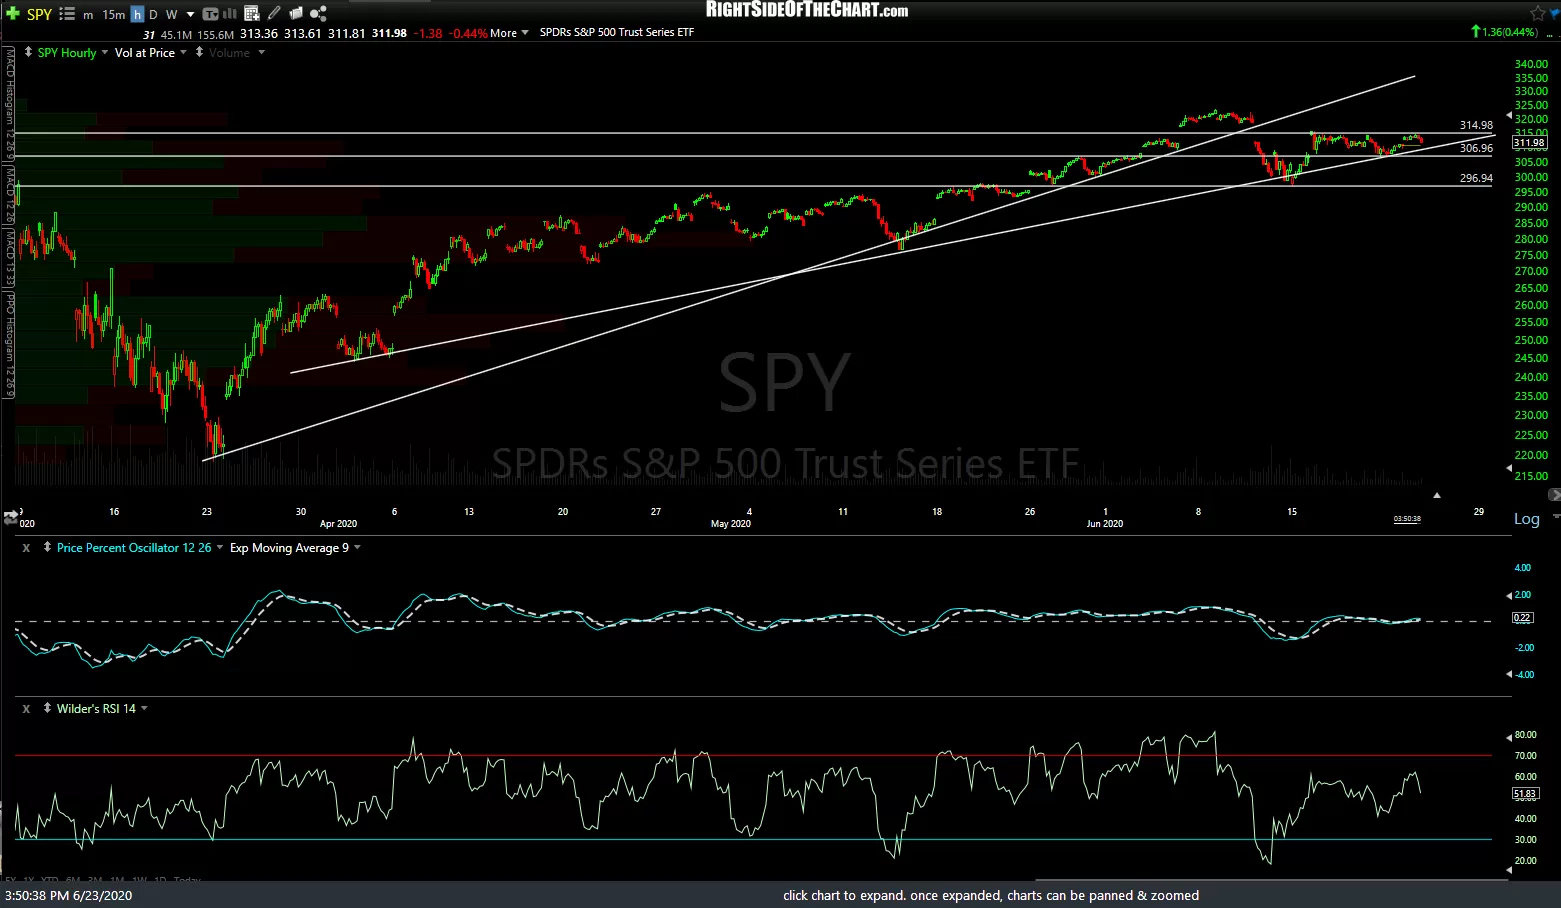
- SPY 60m June 23rd
-
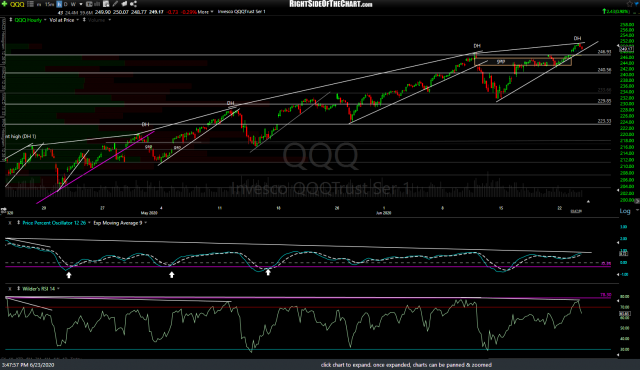
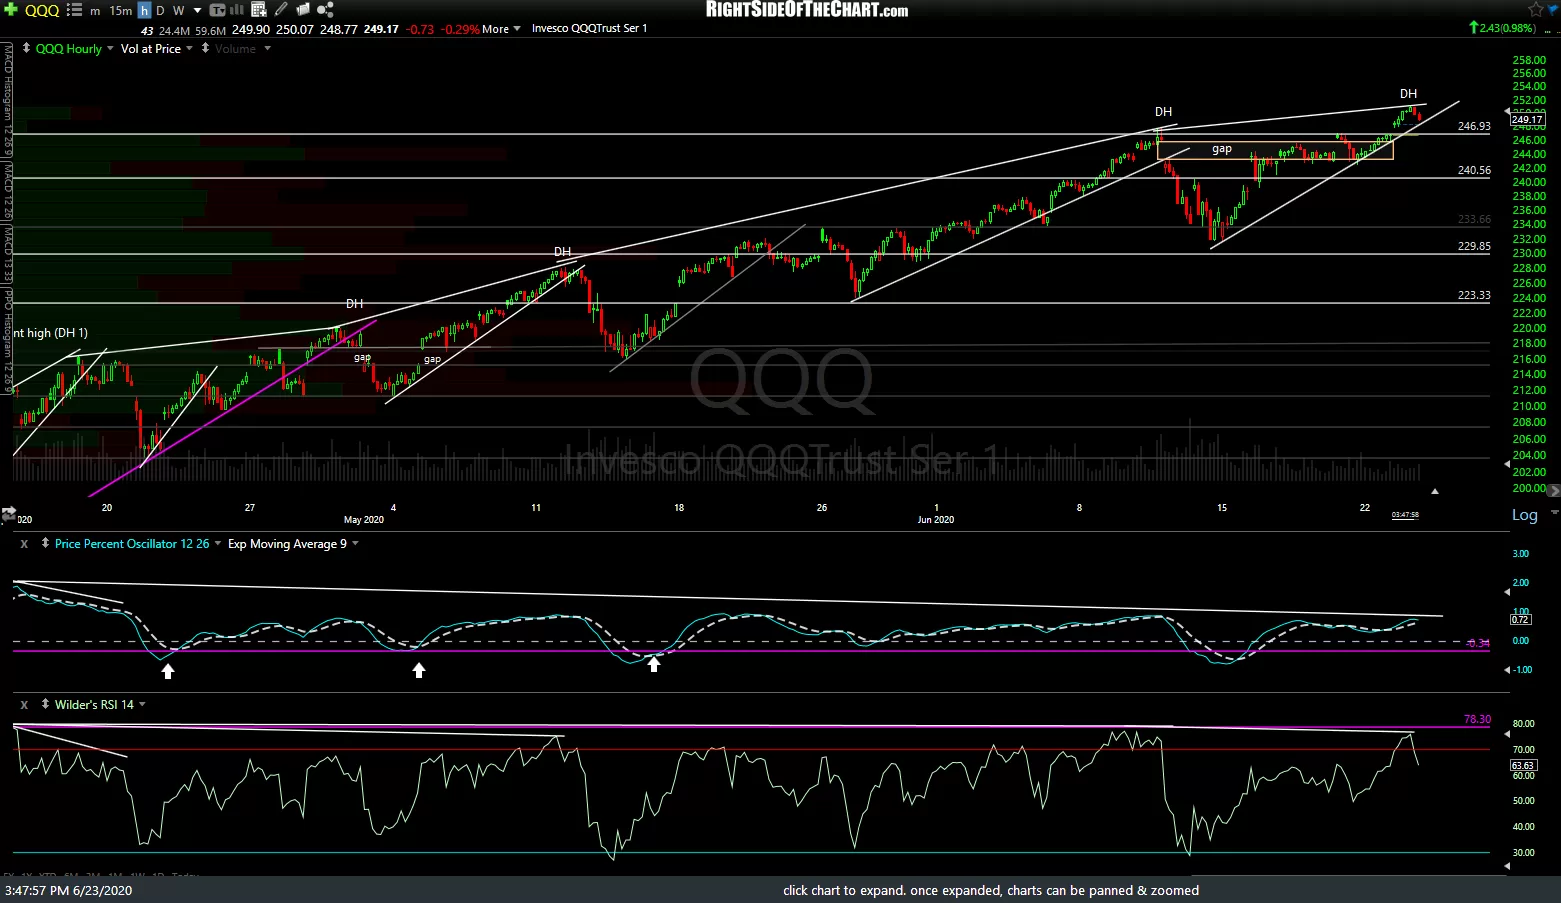
- QQQ 60m June 23rd
-
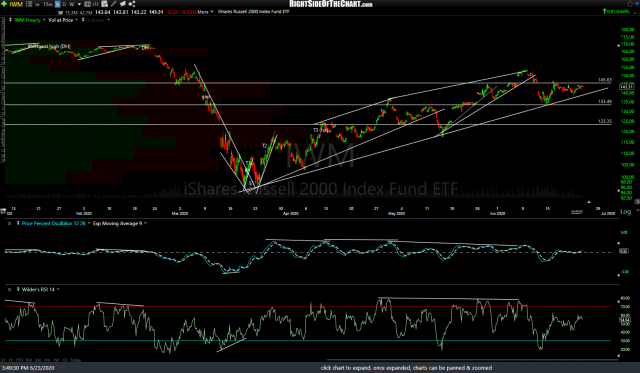
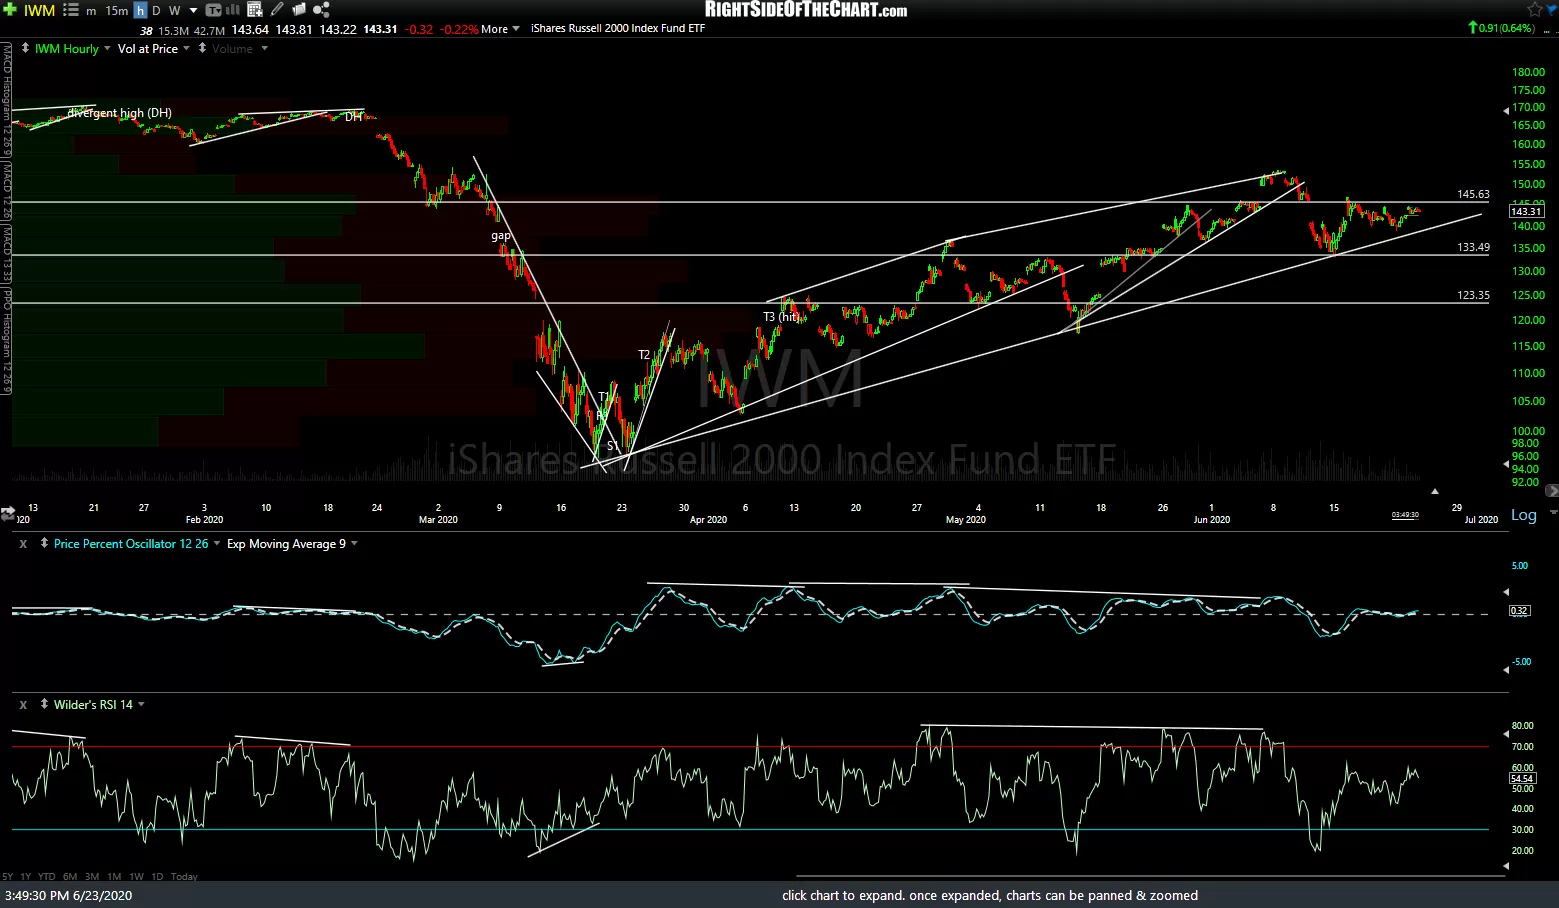
- IWM 60m June 23rd
-
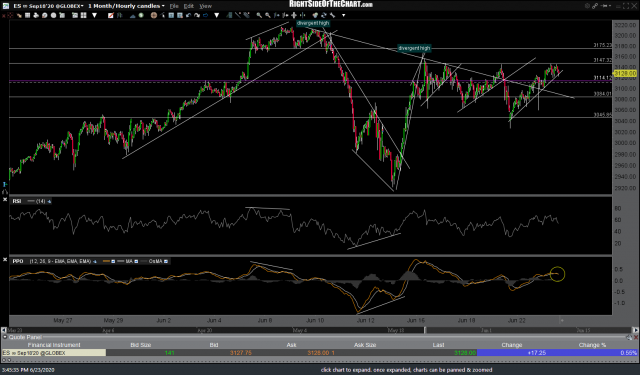
- ES 60m June 23rd

-
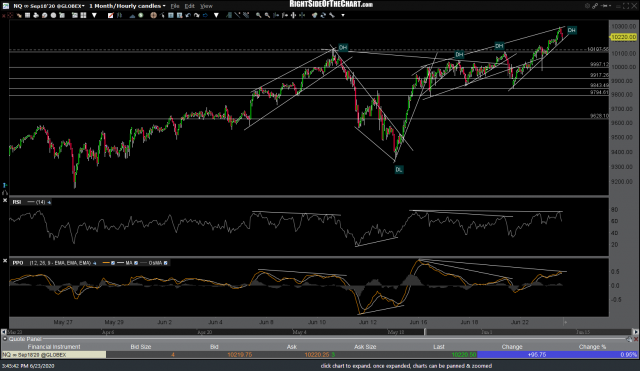
- NQ 60m June 23rd

-
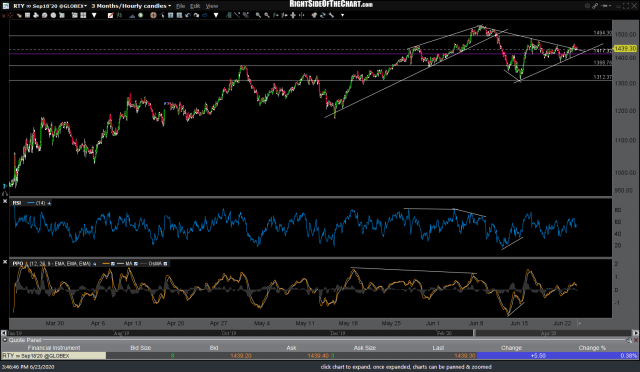
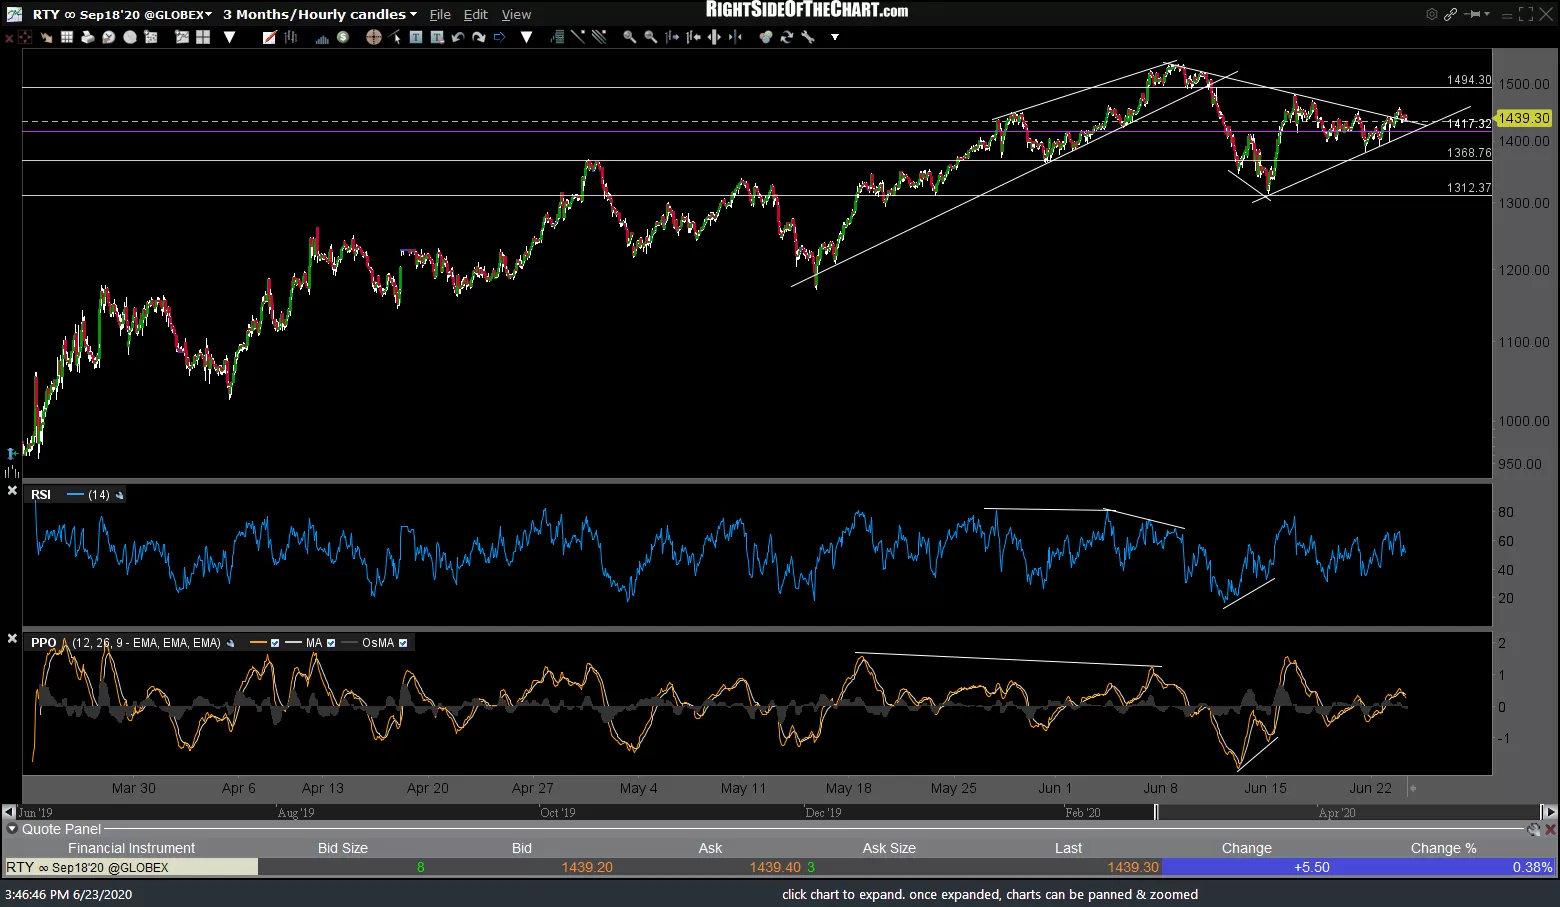
- RTY 60m June 23rd