
I just returned from vacation & wanted to get a few charts out tonight. Regular updates will resume tomorrow.
Both SPY & QQQ basically tested the June 16th highs over the last few session with the broad market in a relatively tight (3%) trading range over the past 23 days. A move down to at least the primary uptrend line off the mid-March lows & quite likely much more in QQQ still seems likely if/when that primary trendline off the Mid-march lows is solidly taken out. It should also be noted that any marginal new high this week or next will still be a divergent high on both the S&P 500 and Nasdaq 100. 60-minute charts of QQQ & SPY below.

QQQ 60m July 5th
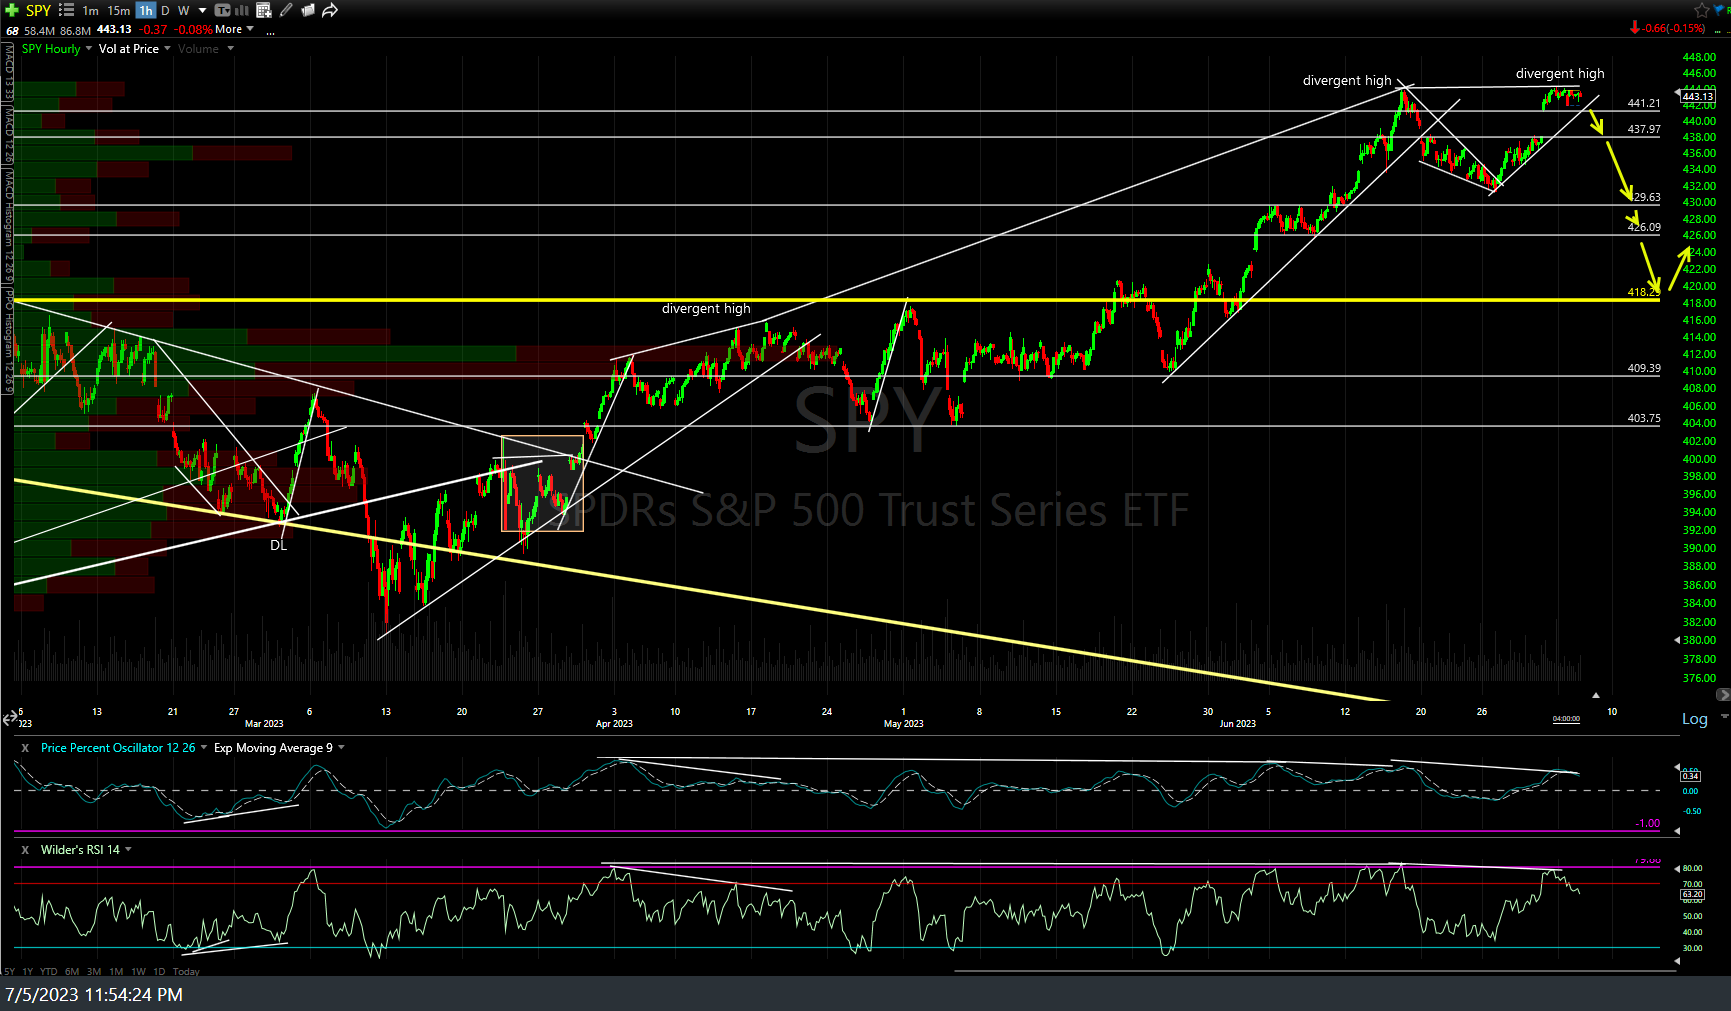
SPY 60m July 5th
/NQ is trading at the bottom of this rising wedge after reversing just shy of the June 16th high with the next sell signal or objective short entry/add-on to come on a solid break below this minor uptrend line (wedge). 60-minute chart below.
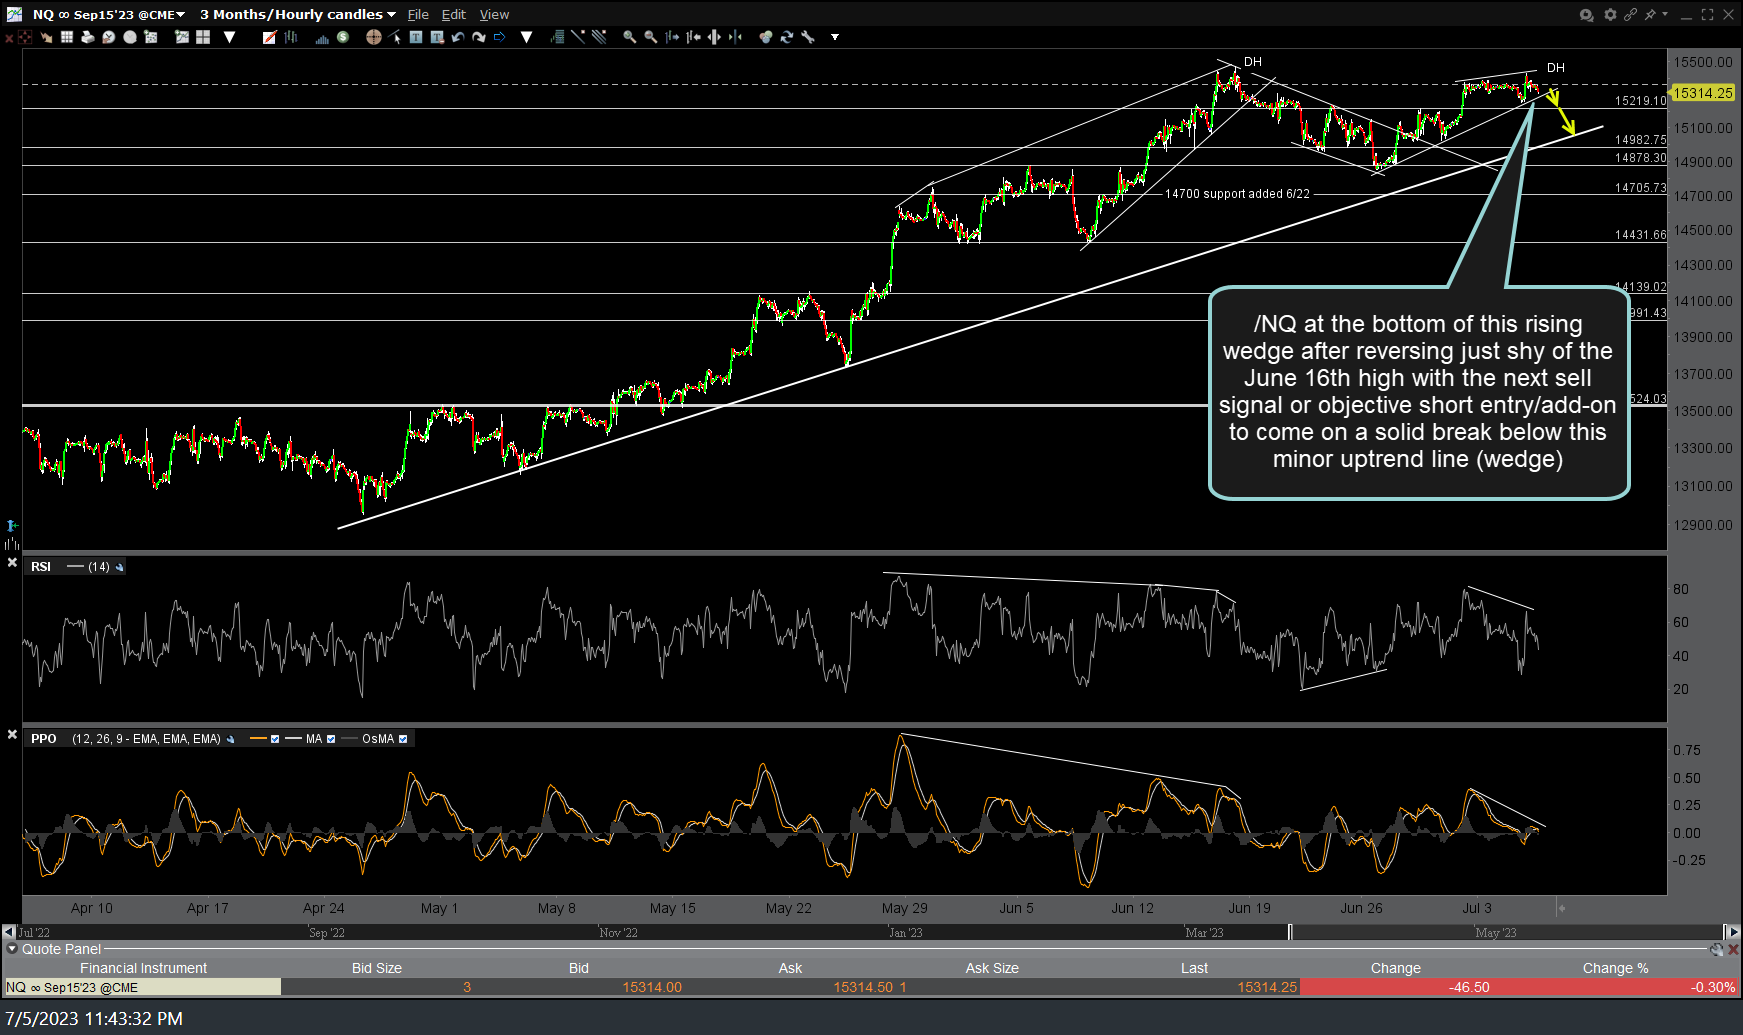
NQ 60m July 5th
Stepping down to the 15-minute time frame, /NQ is current at trendline (bottom of the same wedge shown on the 60-minute chart above) & 15313 price support with the next sell signal to come on a break below both. All marked support lines below on this 15-minute chart are potential targets for active swing traders.

NQ 15m July 5th
Negative divergences also continue to build as /ES tests the June 16th highs. All marked support levels below are potential & likely price targets on the 60-minute chart below.
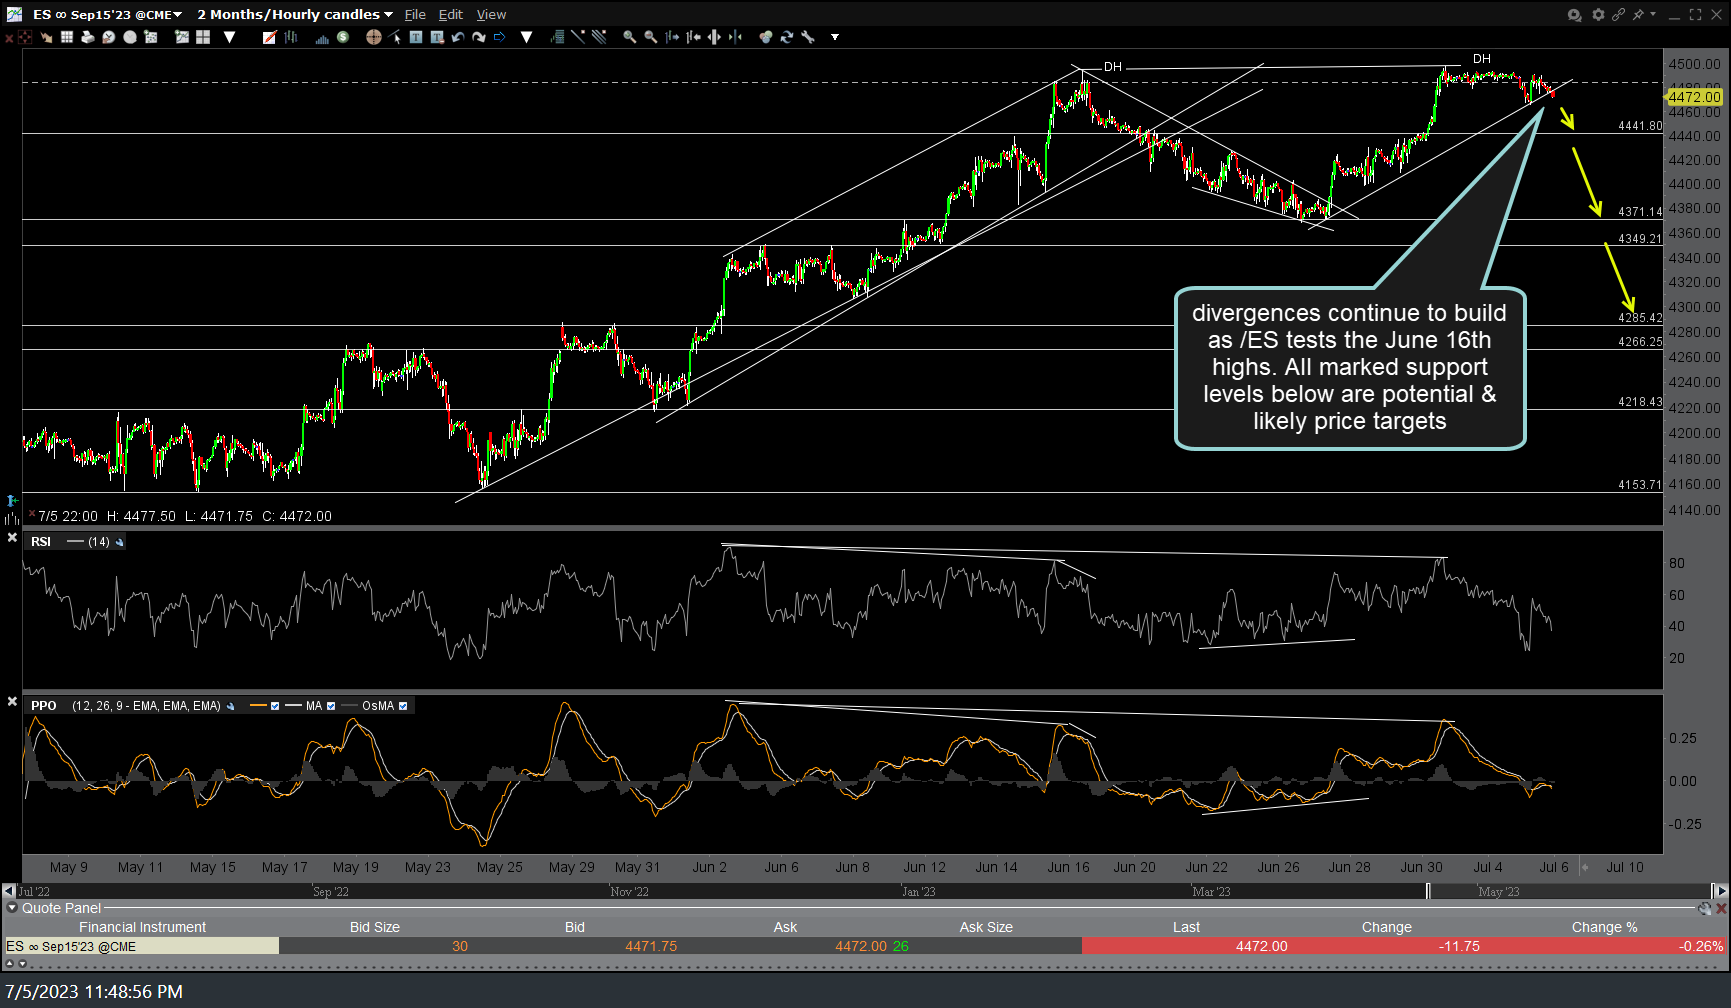
ES 60m July 15th