
The previous charts on the major stock indexes posted earlier today showed some of the levels & developments to watch for on the daily time frame whereas the charts below provide some near-term levels & developments to watch for on the 60-minute time frame.
SPY (S&P 500 ETF) is approaching the top of the key June 11th gap (resistance) while walking up this minor trendline.
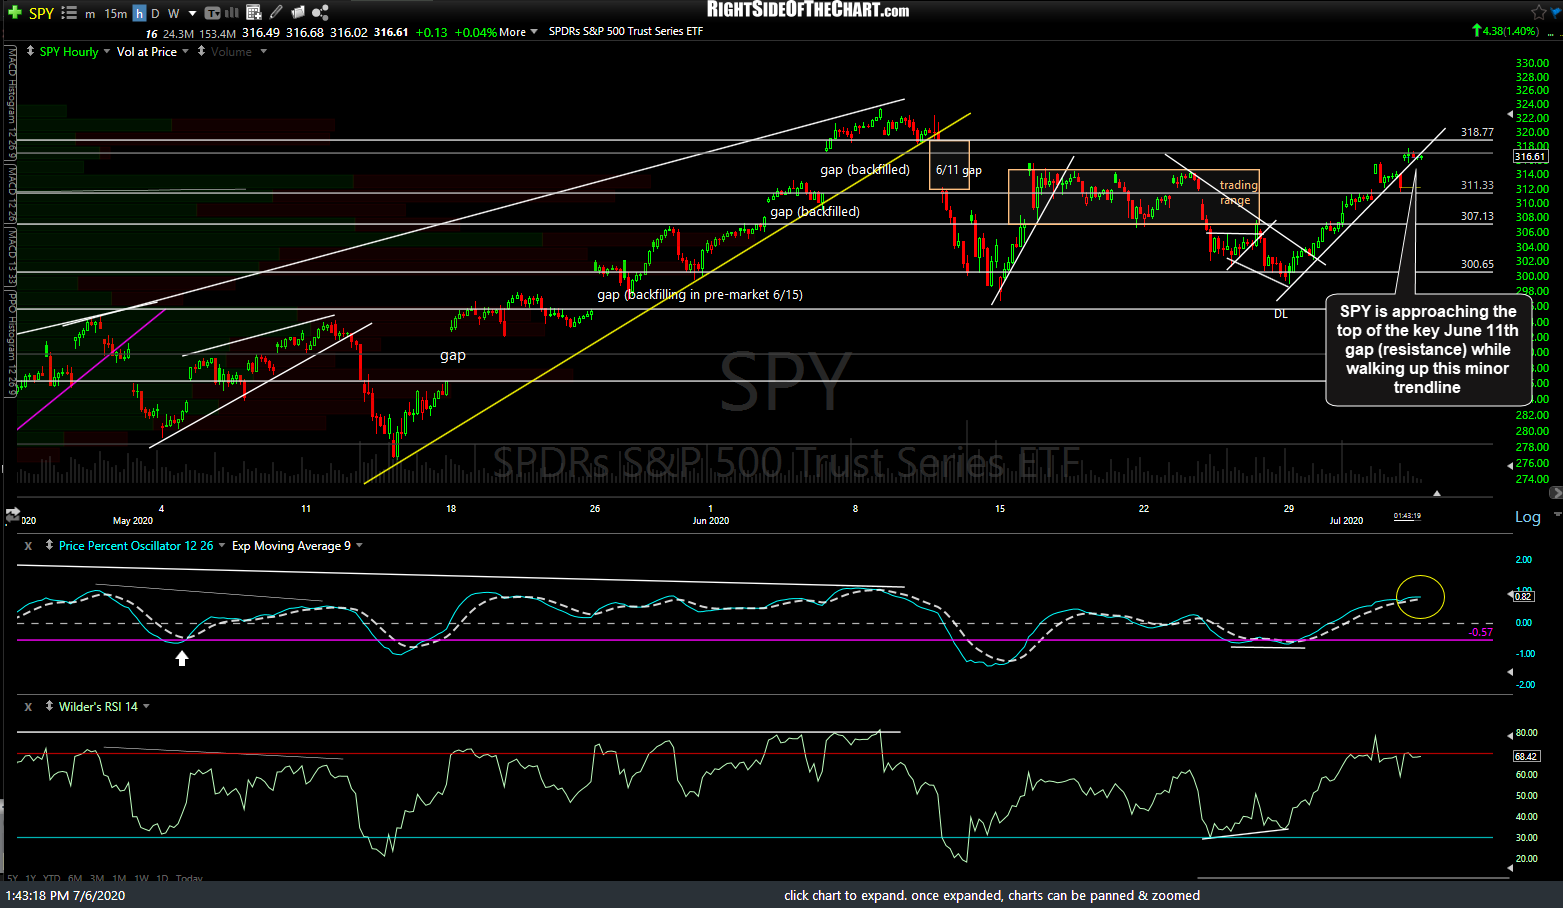
SPY 60m July 6th
/ES (S&P 500 futures) has rallied into the 3175 resistance level with negative divergences in place.
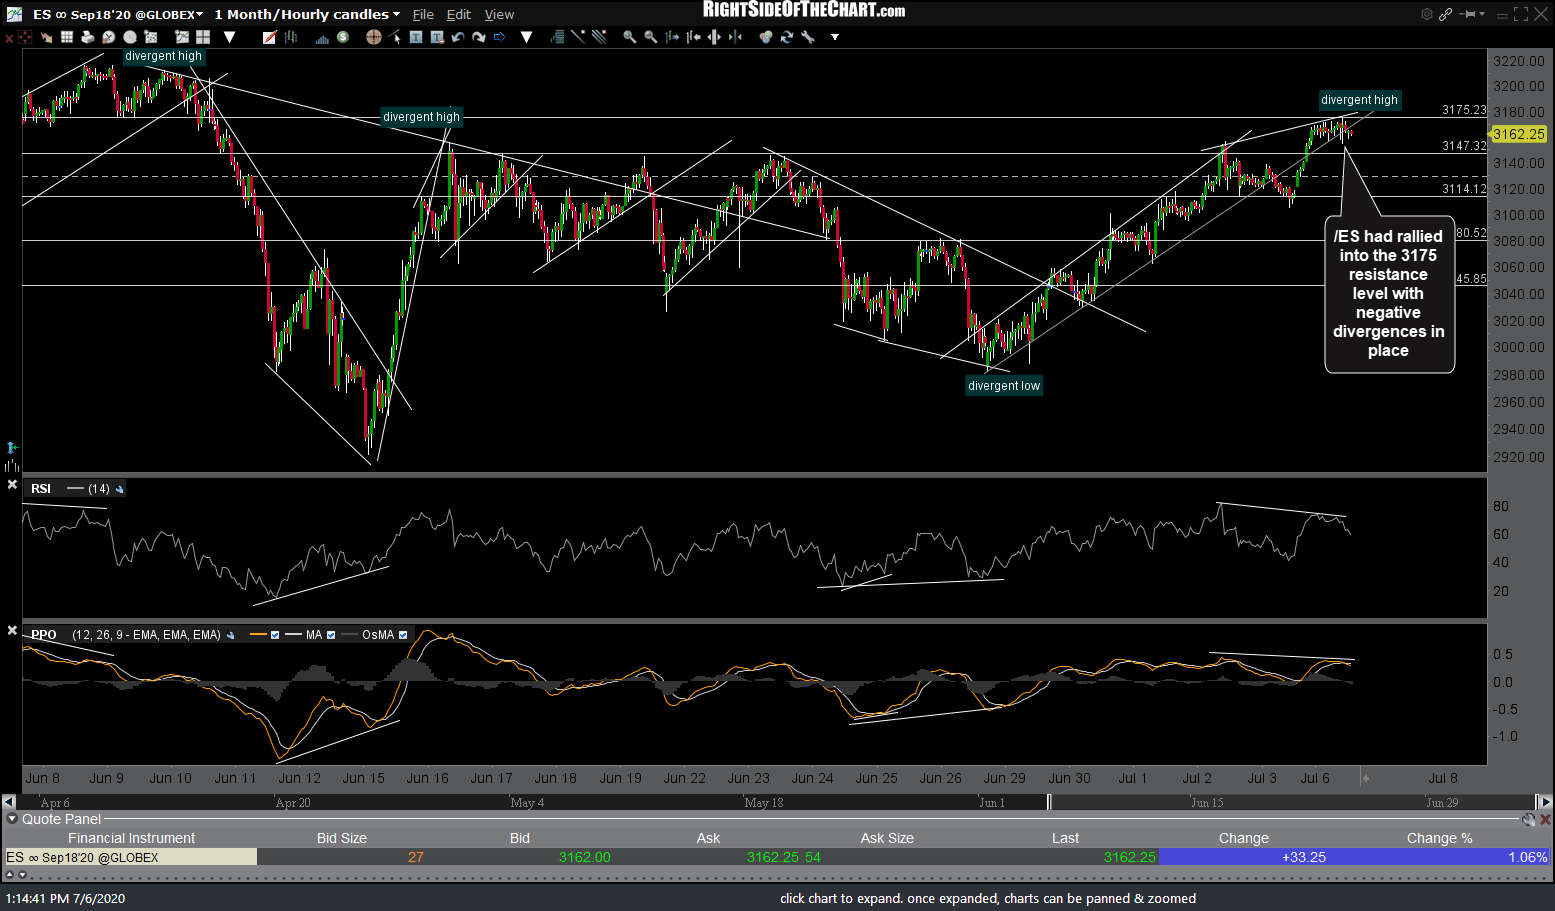
ES 60m July 6th
QQQ (Nasdaq 100 ETF) is riding up this 60-minute trendline with a sell signal to come on a solid break below. On watch for a high-level crossover on the PPO to confirm any sell signal on a break below the trendline.

QQQ 60m July 6th
There are also negative divergences building on this /NQ (Nasdaq 100 futures) 60-minute chart with some of the nearby support levels/potential pullback targets shown.
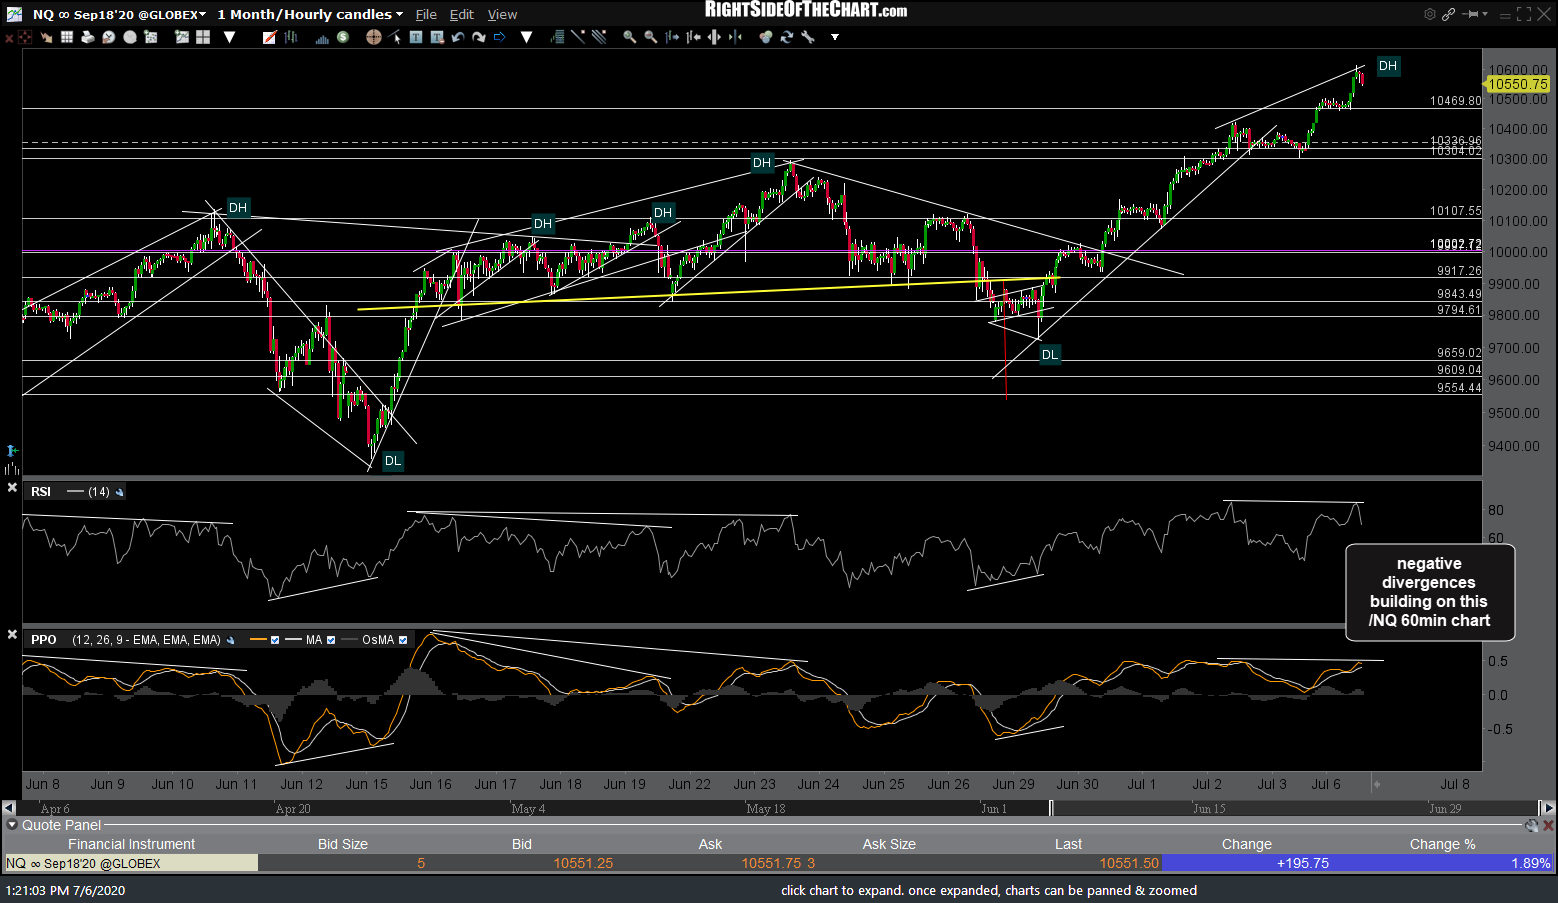
NQ 60m July 6th
IWM (Russell 2000 Small-Cap ETF) is backtesting the recently broken trendline + 145.63 resistance level.

IWM 60m July 6th
/RTY (Russell 2000 futures) sell signal to come on a solid break below this uptrend line + 1417 support with the next decent overhead resistance, should it continue to walk up the trendline, around 1494.30.
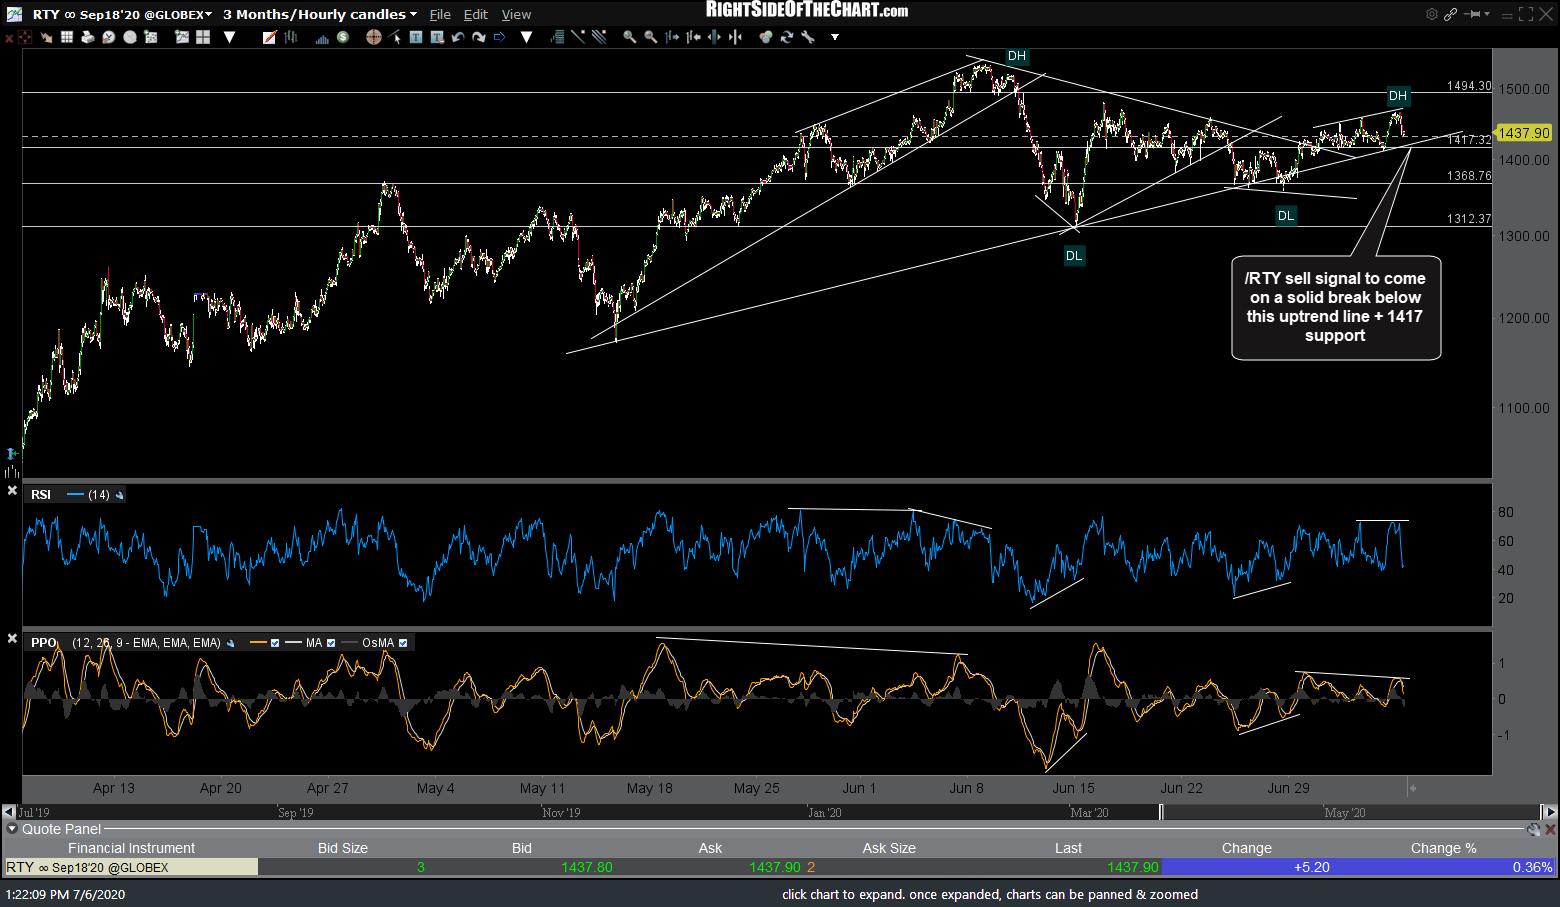
RTY 60m July 6th