
Some days I struggle to find any significant developments or price levels on the charts of the major stock indexes but today certainly isn’t one of those days. Yesterday, I had highlighted the breakout in /NQ (Nasdaq 100 futures) above the downtrend line on the 60-minute chart which pretty much brought the index to the upper-most ceiling of the recent trading range that it has been locked in for the past several weeks. /NQ has continued to backtest the downtrend line that it broke out above yesterday morning since then so as of now, the breakout is still intact.
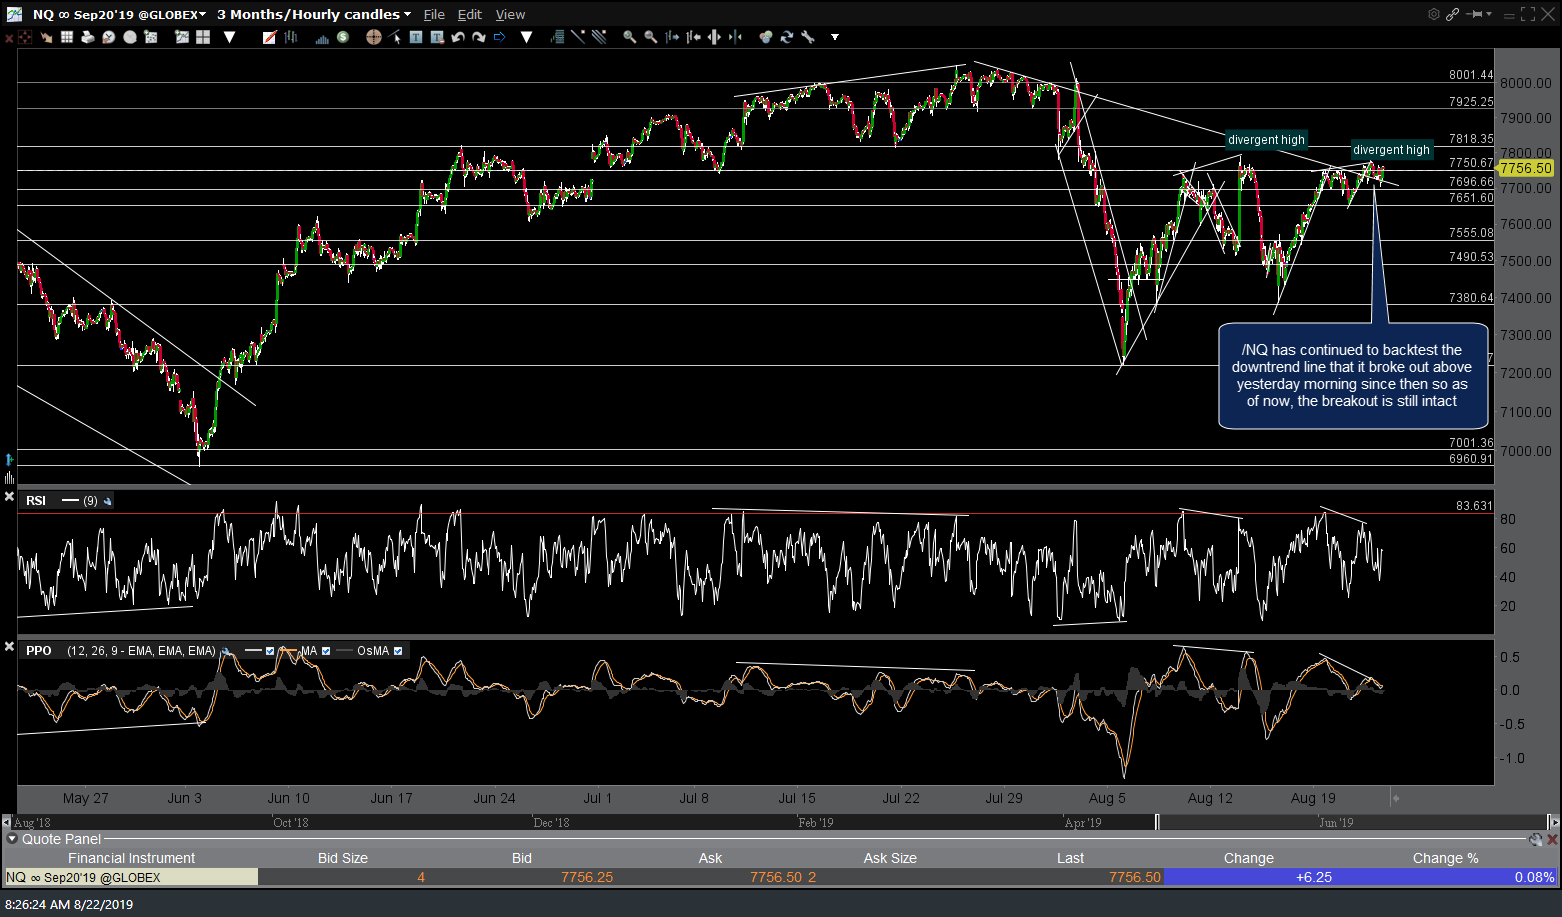
NQ 60-min Aug 22nd
If you are wondering what has held /NQ back from rallying following the breakout & successful (so far) backtest of the trendline from above, all we have to do is look at the “other” major large-cap index, the S&P 500. As I had mentioned yesterday, SPY & /ES have slightly lagged behind /NQ & QQQ on the most recent advance with the $SPX falling just shy of the top of its comparable trading range over the past several weeks. However, not only has /ES has now inched its way up the top of that trading range (i.e.- a significant resistance level) but it also now testing the key downtrend line off the July highs as well.
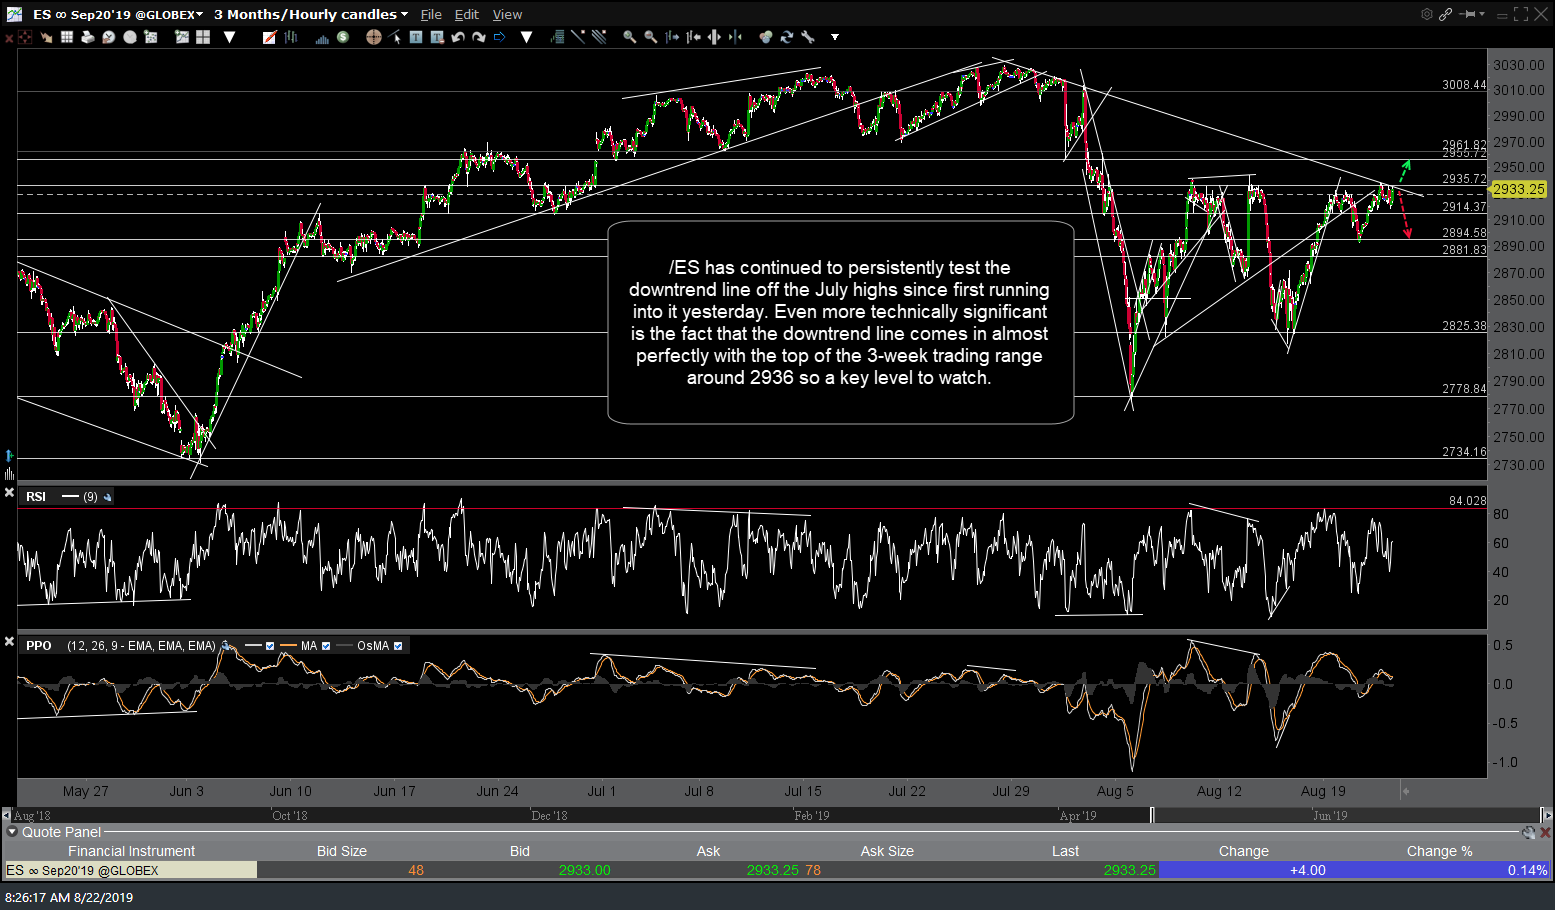
ES 60-min Aug 22nd
Basically, we now have the S&P 500 sitting just below key resistance with the Nasdaq 100 recently breaking out & holding above key resistance but not going anywhere since as the $NDX can’t go far without the $SPX following & vice versa due to the large overlap between many of the components of each index. Not by mere coincidence, while the major stock indices are currently positions at a key level which would be bearish if they fail to surmount & bullish if they do, the risk-off assets such as gold & Treasuries (see today’s previous post) are also sitting right on key support levels which are likely to spark a correction if taken out as well.
At the very least, today should be interesting as it certainly has the potential to set the tone for the next major trend in both the stock market as well as gold & Treasury bonds. Should the indexes breakout with gold and/or Treasuries breaking down, the risk of a whipsaw signal (false breakout) is certainly elevated based on the posture of the longer-term charts so we’ll just have to be vigilant & flexible if that proves to be the case.
Good trading.
-rp