
/NQ (Nasdaq 100 futures) has rallied into the 7722 resistance level with the next sell signal to come on a break above this uptrend line along with confirmation via a break below the comparable trendline on /ES (S&P 500 futres). The yellow circles show all extreme overbought readings at this level on the RSI, all of which were followed by corrections. Will this time be different? I’m also watching for a high-level bearish crossover on the PPO as additional confirmation of a sell signal. 60-minute charts below.
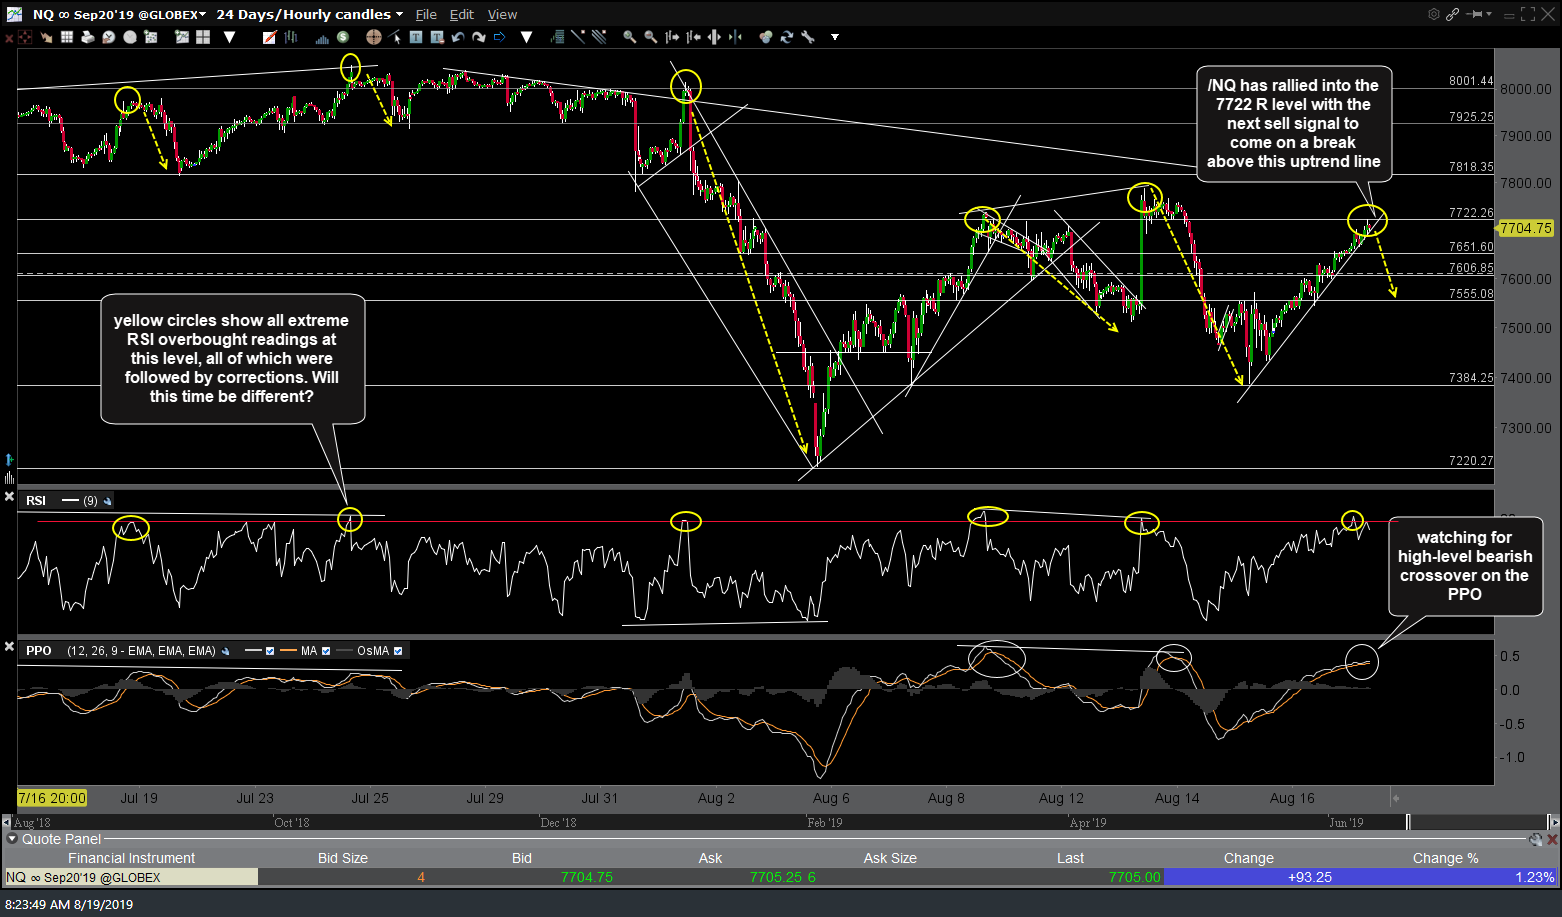
NQ 60-min Aug 19th
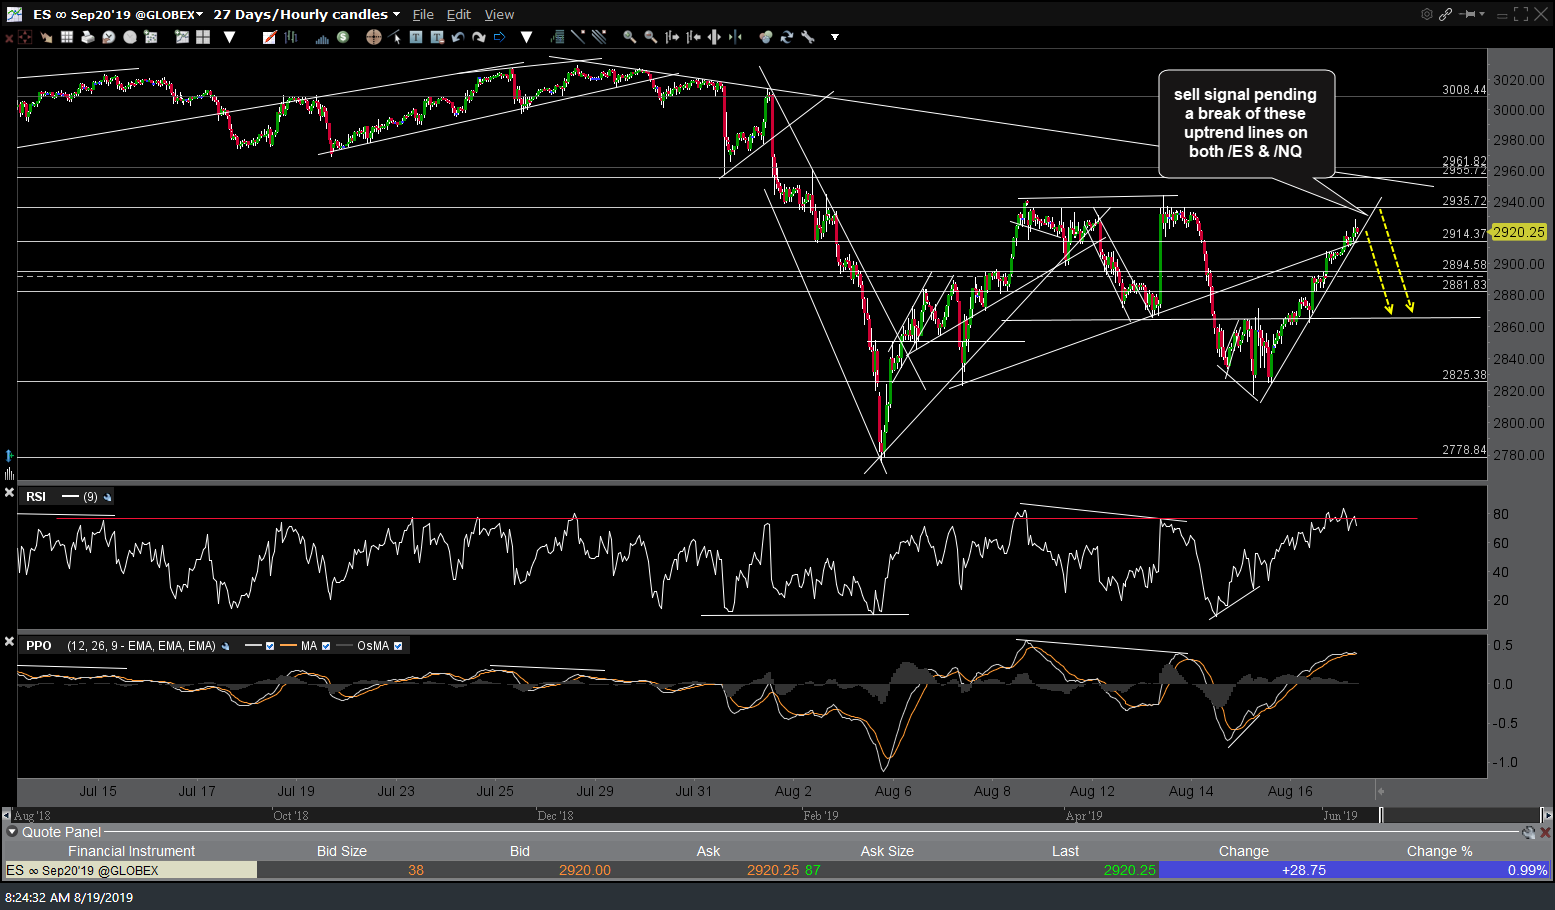
ES 60-min Aug 19th