
/NQ (Nasdaq 100 futures) broke out above this 60m bullish falling wedge pattern late yesterday & has rallied into the 11540-11600ish resistance zone where a ~2% pullback is likely.

NQ 60m Oct 4th
Likewise, /ES (S&P 500) also broke out above this 60-minute bullish falling wedge pattern late yesterday & has rallied into the 3755-3765ish resistance zone where a ~2% pullback is likely.
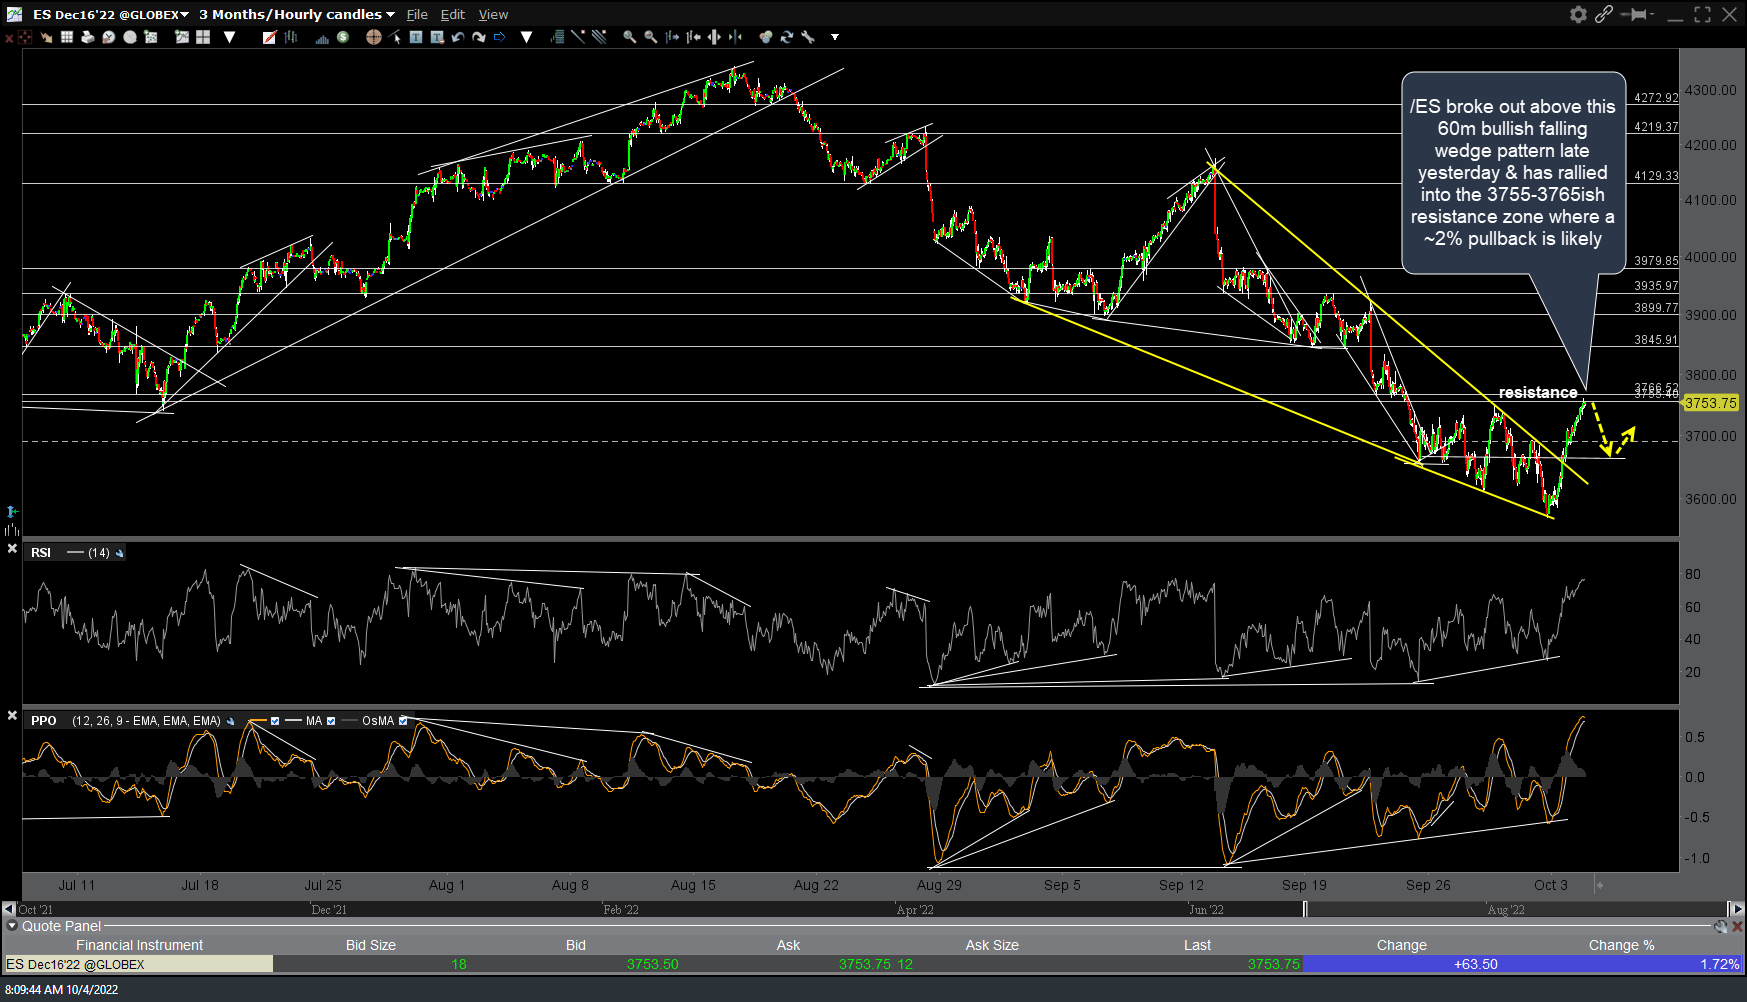
ES 60m Oct 4th
As of now, the S&P 500 & Nasdaq have successfully tested & still hold above the significant mid-June lows with a slight undercut & recovery back above while the positive divergences remain intact, for now. I still suspect this key support level will be taken out soon with another major leg down to my next long-term swing target around 235 on the QQQ weekly chart (T4) but certainly acknowledge the potential for a substantial rally from here, should this seemingly bullish technical setup on the major stock indexes play out.
I will do my best to post additional updates as time permits, including my thoughts on the next move in the stock market, whether my ~2% pullback call from these levels (shortly before 8:30 am EST) plays out or not.