
/ES (S&P 500) is once again testing the 2882.75 resistance level with any marginal move above that level to be a divergent high & a break below this minor uptrend line likely to spark the next wave of selling. 60-minute chart below.
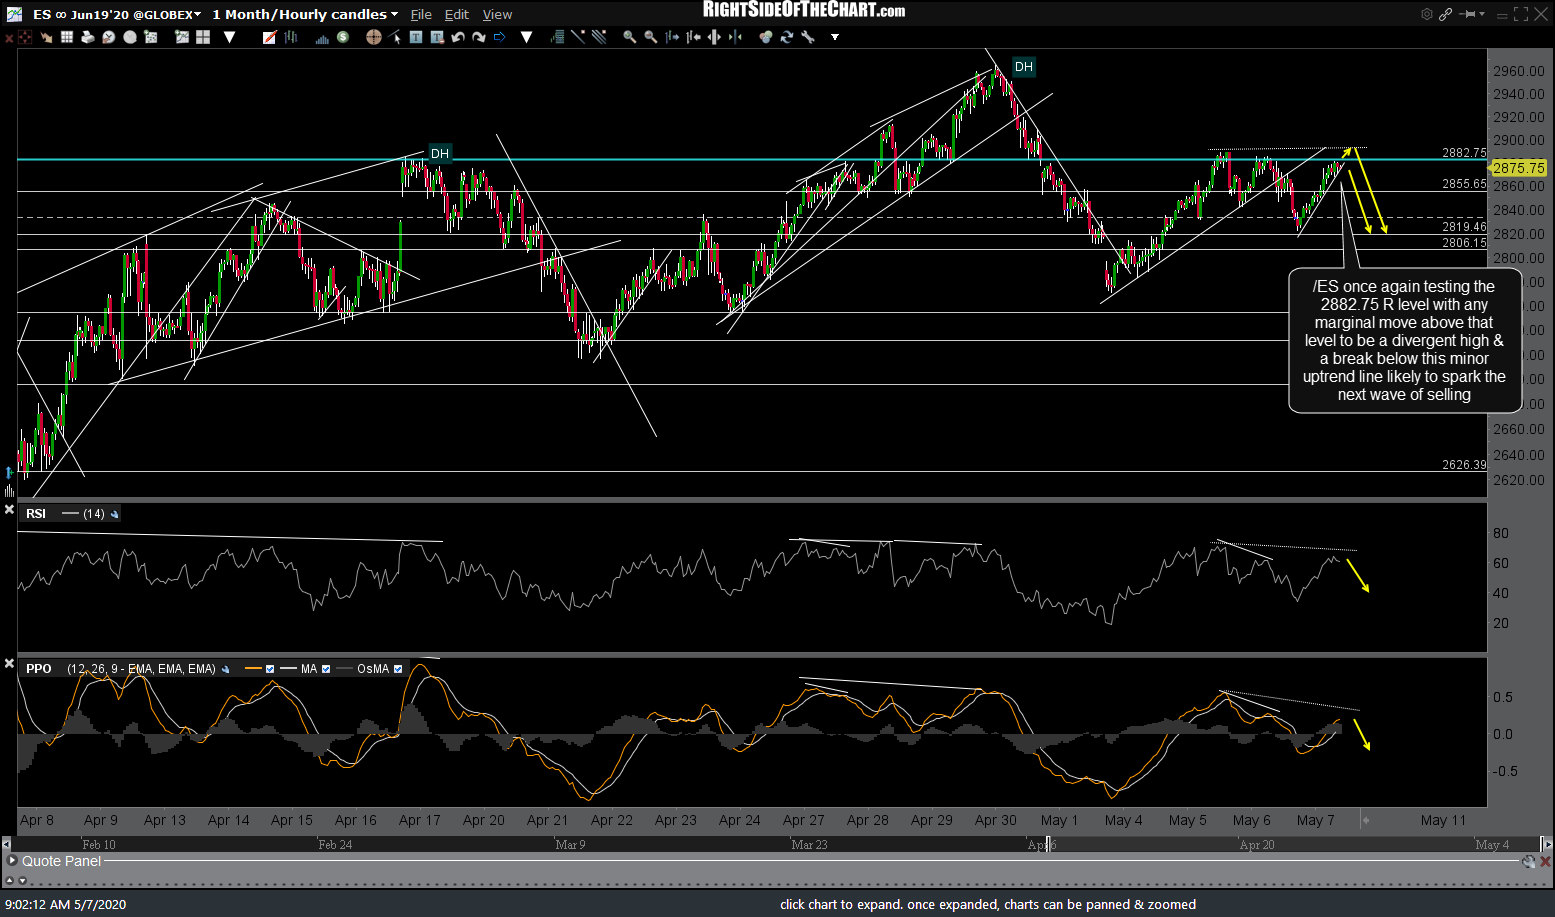
ES 60m May 7th
/NQ is currently backtesting the primary (blue) and minor (white) uptrend lines while extending the existing divergences with a break below this minor trendline to trigger the next sell signal. 60-minute chart below.
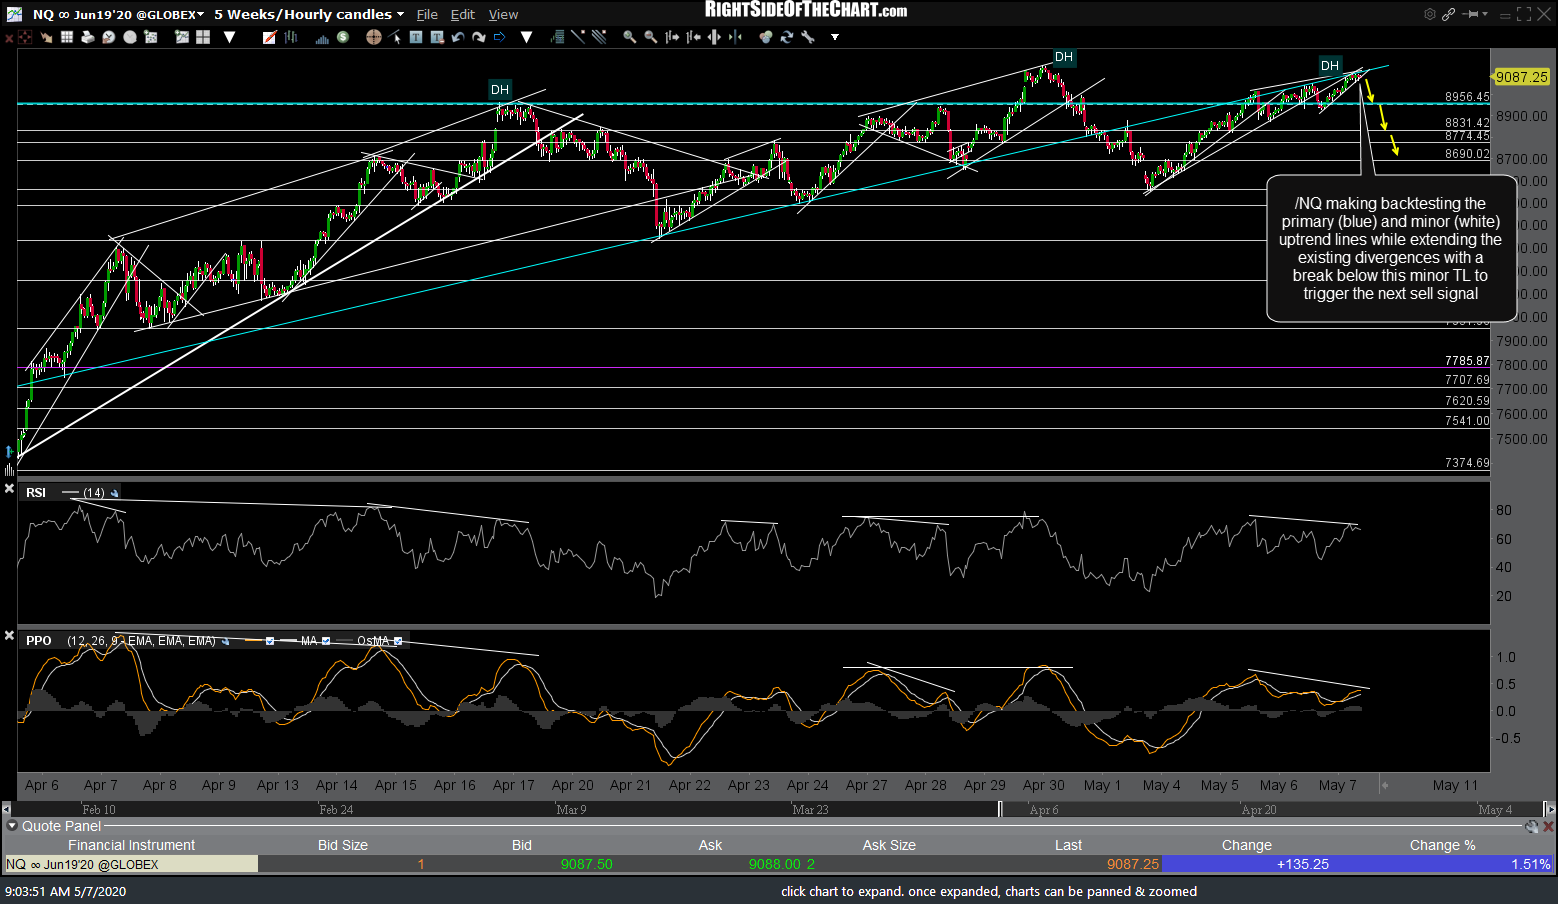
NQ 60m May 7th