
In addition to the odds of profit taking in front of next week’s FOMC meeting & earnings from, by far, the most potentially market-moving companies (AAPL, MSFT, GOOGL, & META) increasing from here with each tick higher on the heels the double-digit rally over the past 5 weeks or so, the 120-minute charts of /ES (S&P 500), /NQ (Nasdaq 100), & /RTY (Russell 2000) below have about 3 other reasons why I booked profits on longs & went to a net short positioning yesterday (which I am sticking with for now):
- All three major indexes have rallied into the key 38.2% Fibonacci retracement levels of the major leg down from the March 29th highs to the June 16th lows
- All three major indexes have negative divergences (prices making higher highs with the momentum indicators making equal or lower highs)
- All three major indexes are at or very near significant price resistance levels
Yes, that whole “paradigm shift” thing still very much appears to be in play but at this time I think that, at best, the “easy” money from the initial leg off the mid-June lows has been made & we’re more likely to see the rate of ascent slow or stall out as traders become hesitant to take new long positions in front of next week’s FOMC meeting & biggest earnings week of the entire season while at worst, we could see substantial profit taking in front of the aforementioned market-moving events next week. Maybe, maybe not but what I can stay with certainty is that the risk/reward to longs is not nearly as attractive as it was a month or so ago & as such, this appears to be a good time for those with nice profits on longs over the past month or so to either book some profits or at least tighten up stops to protect them.

ES 120m July 21st

NQ 120m July 21st
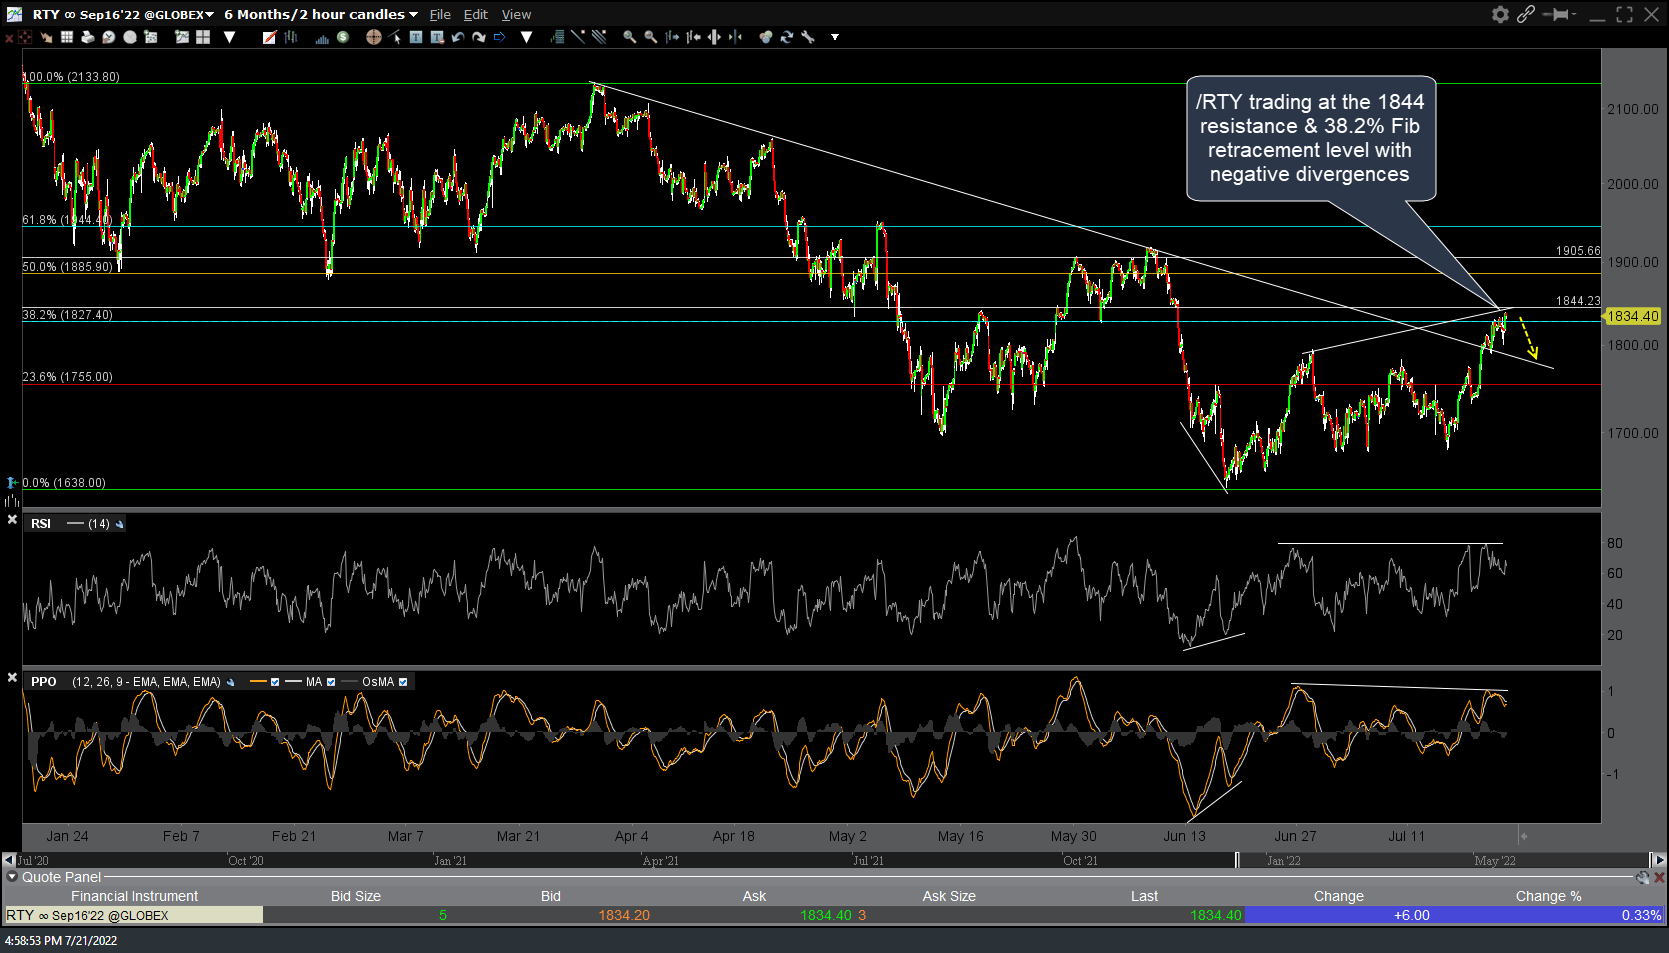
RTY 60m July 21st