
Breakdown & backtest of the primary uptrend line on SPY, with a pullback to the 200-day MA’s & interesting 600ish support, a potential & likely near-term target on the daily chart below.
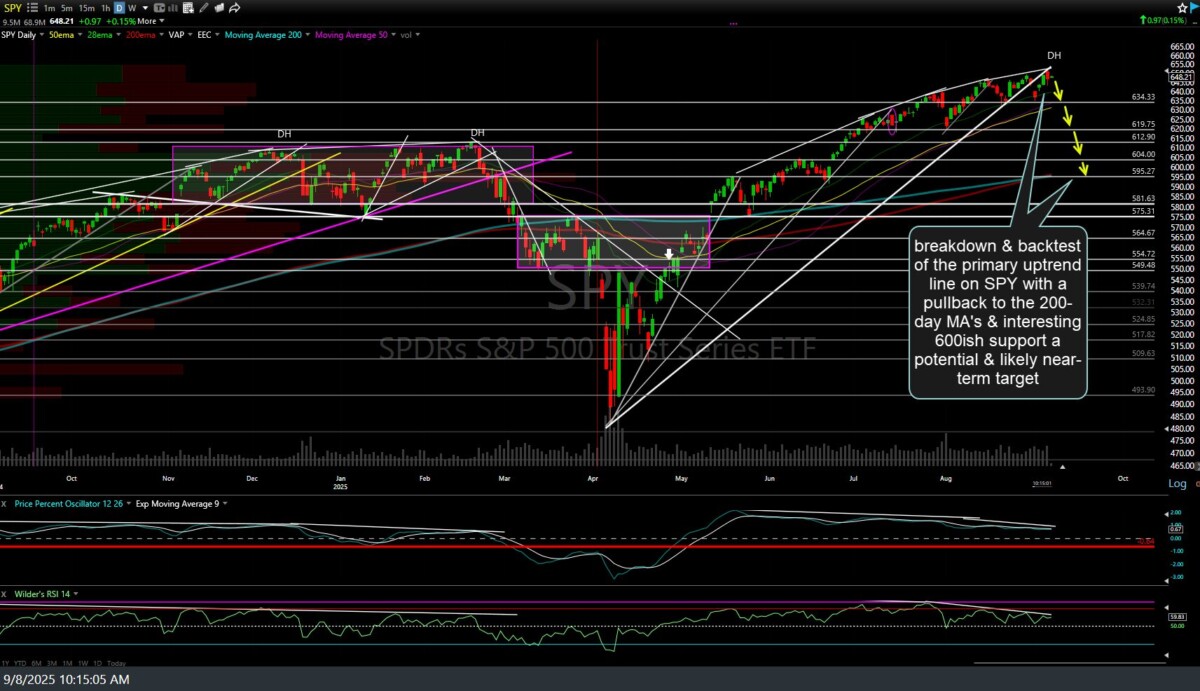
SPY daily Sept 8th
Likewise, we have a recent breakdown & current backtest of the primary uptrend line on RSP (equal-weighted S&P 500 ETF) with a pullback to the 200-day MA’s & interesting 180ish support a potential & likely near-term target.
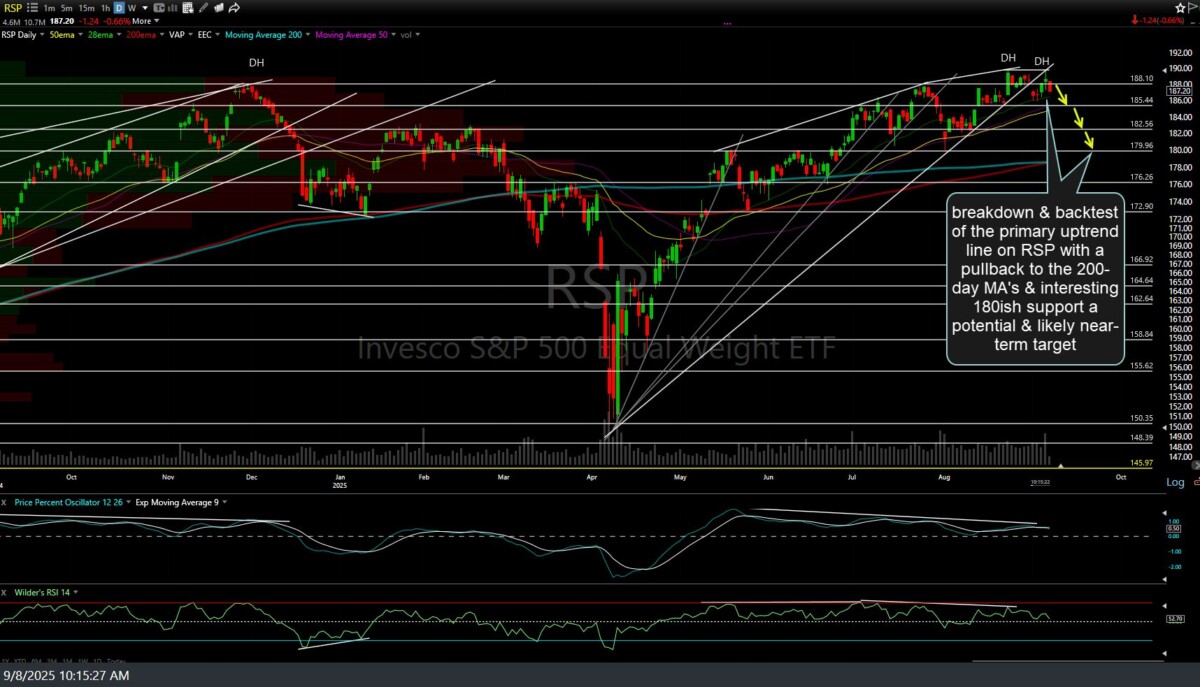
RSP daily Sept 8th
QQQ (Nasdaq 100 ETF) is currently backtesting the minor uptrend line on this 60-minute chart following Friday’s breakdown below it. The economic calendar is fairly light until mid/late-week, with some of the inflation reports due. As such, barring any unexpected headlines, the major indices are likely to grind around for the next day or so, potentially printing a close slightly above the suggested stop of a daily close above 580 on QQQ (as such, anyone in that trade will have to decide whether to stick with that stop or give it a little room until the inflation reports come out later this week). The charts above also mark key support & resistance levels that could spark rallies or sell-offs, if & when taken out.
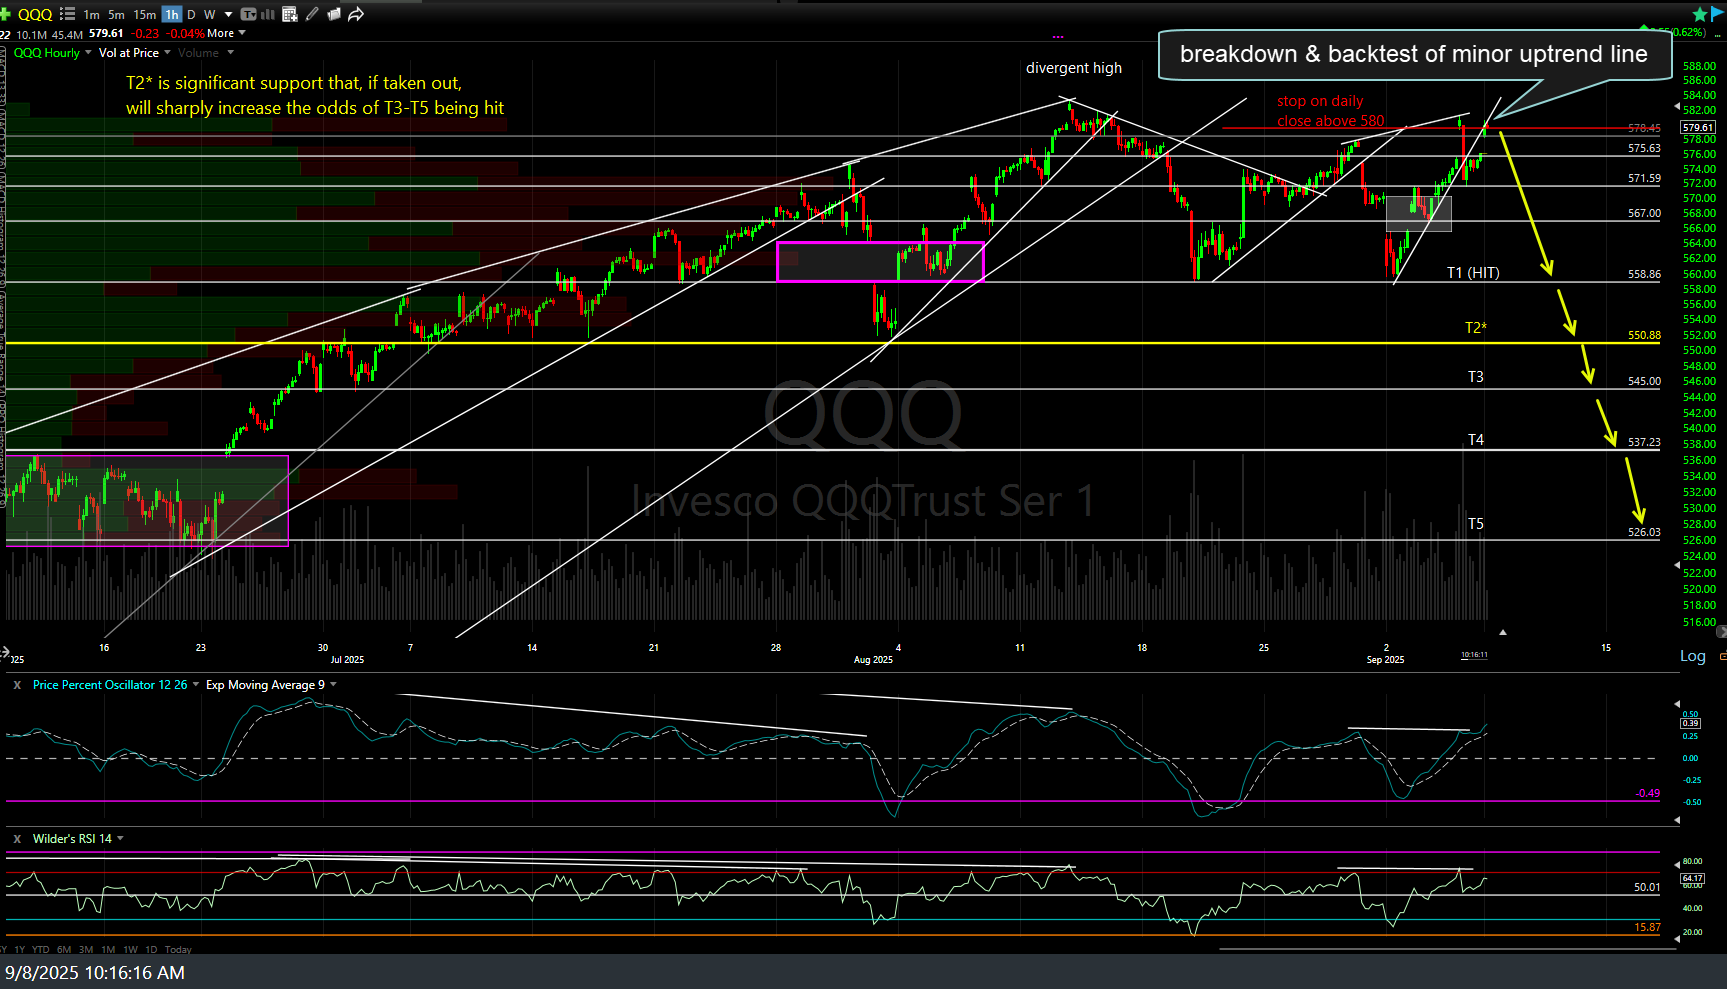
QQQ 60m Sept 8th
Natural gas (/NQ & UNG) has taken out the next resistance levels, thereby opening the door to the next price targets. Other than that, I’m not seeing much that stands out so far today, although I will continue to pore over the charts looking for any attractive trading opps.