
SPY has moved above the top of Monday’s bearish engulfing candle without confirming it as a sell signal with a drop & close below it. Until & unless today’s gains are faded soon with a break below 364 & ideally with a reversal of the breakdown in Treasury bonds, this can only be construed as near-term bullish price action so let’s see how the indexes finish the day.

SPY daily Jan 7th
QQQ has yet to confirm Monday’s bearish engulfing candle with a break of that low, nor is the 3-days of sideways trading since the ideal follow-through to a bearish engulfing candle as a potential reversal stick although a break of Monday’s low would still likely spark an impulsive wave of selling should it occur in the coming trading sessions. Daily chart below.
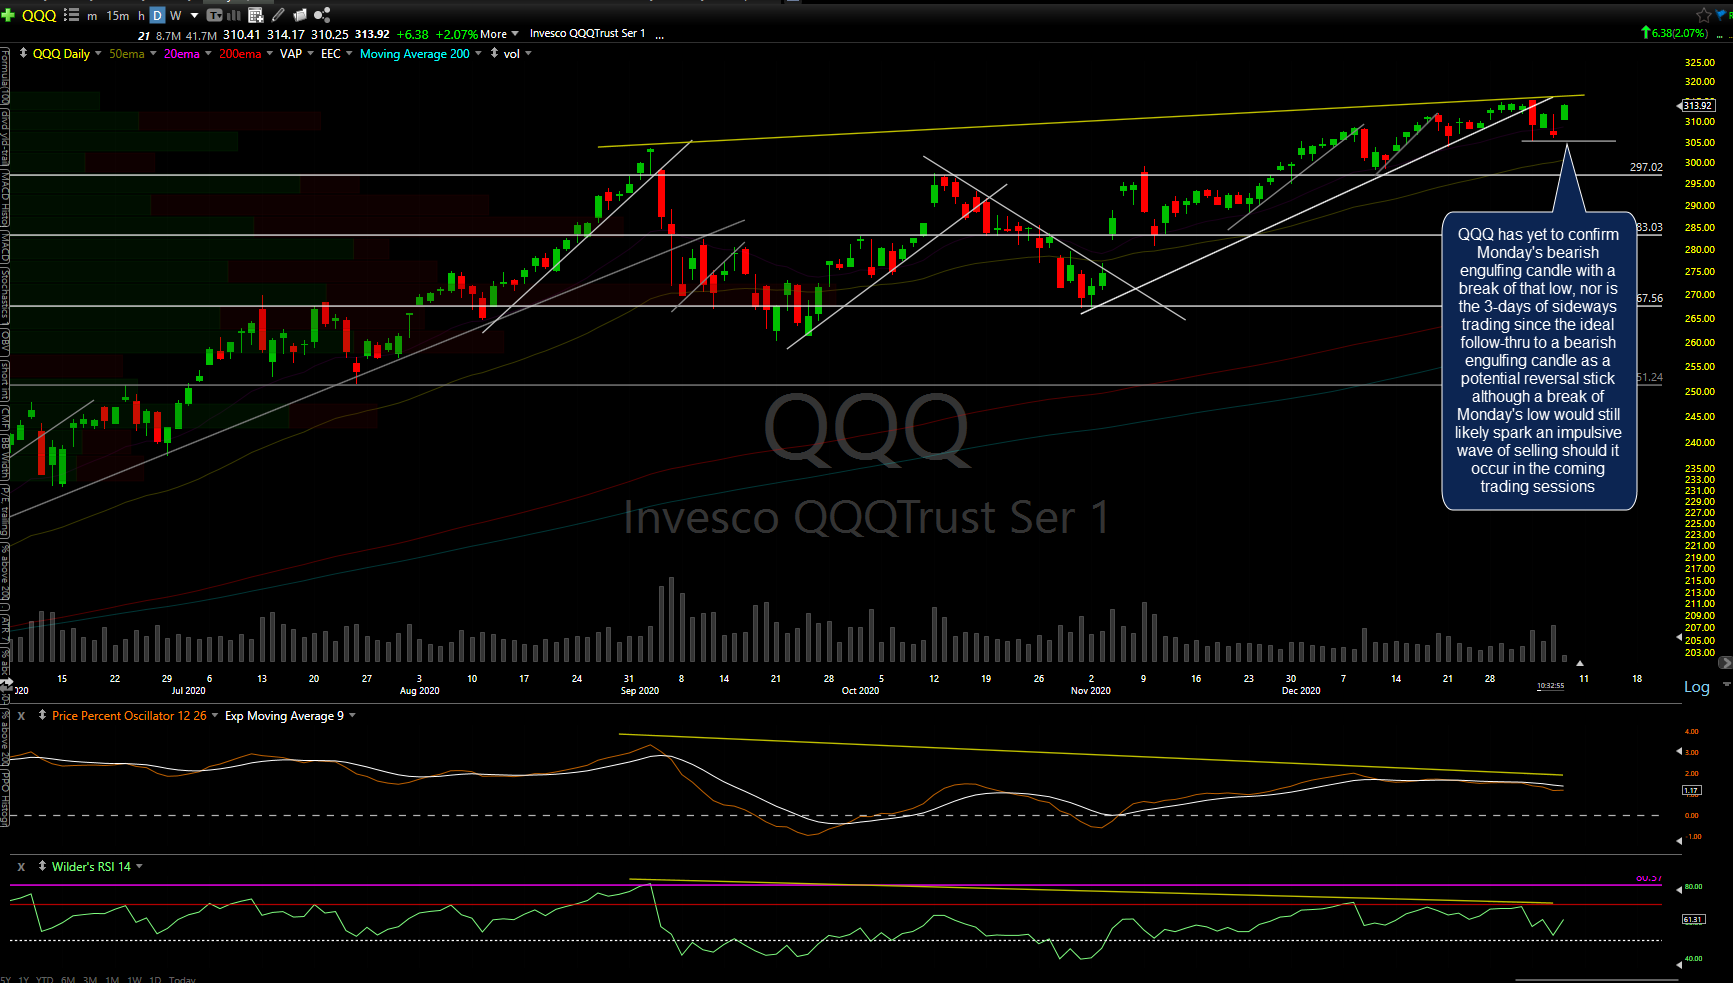
QQQ daily Jan 7th
Zooming down to the 60-minute time frame, QQQ is still backtesting although not the ideal follow-thru to Monday’s breakdown so far, especially with SPY taking out the previous highs today. I will say that I have seen plenty of instances where either the S&P 500 or Nasdaq 100 was exhibiting bullish price action yet the other index had recently broken down with that breakdown (sell signal) sticking & ultimately dragging down the other major large-cap index with it. As such, I’ll be eager to see how the indexes close today and follow-through tomorrow.

QQQ 60m Jan 7th
IEF (7-10 yr Treausry-bond ETF) continues to sell-off impulsively following yesterday’s breakdown below the key 119.18 support which is bullish for stocks until & unless the breakdown were to fail soon.
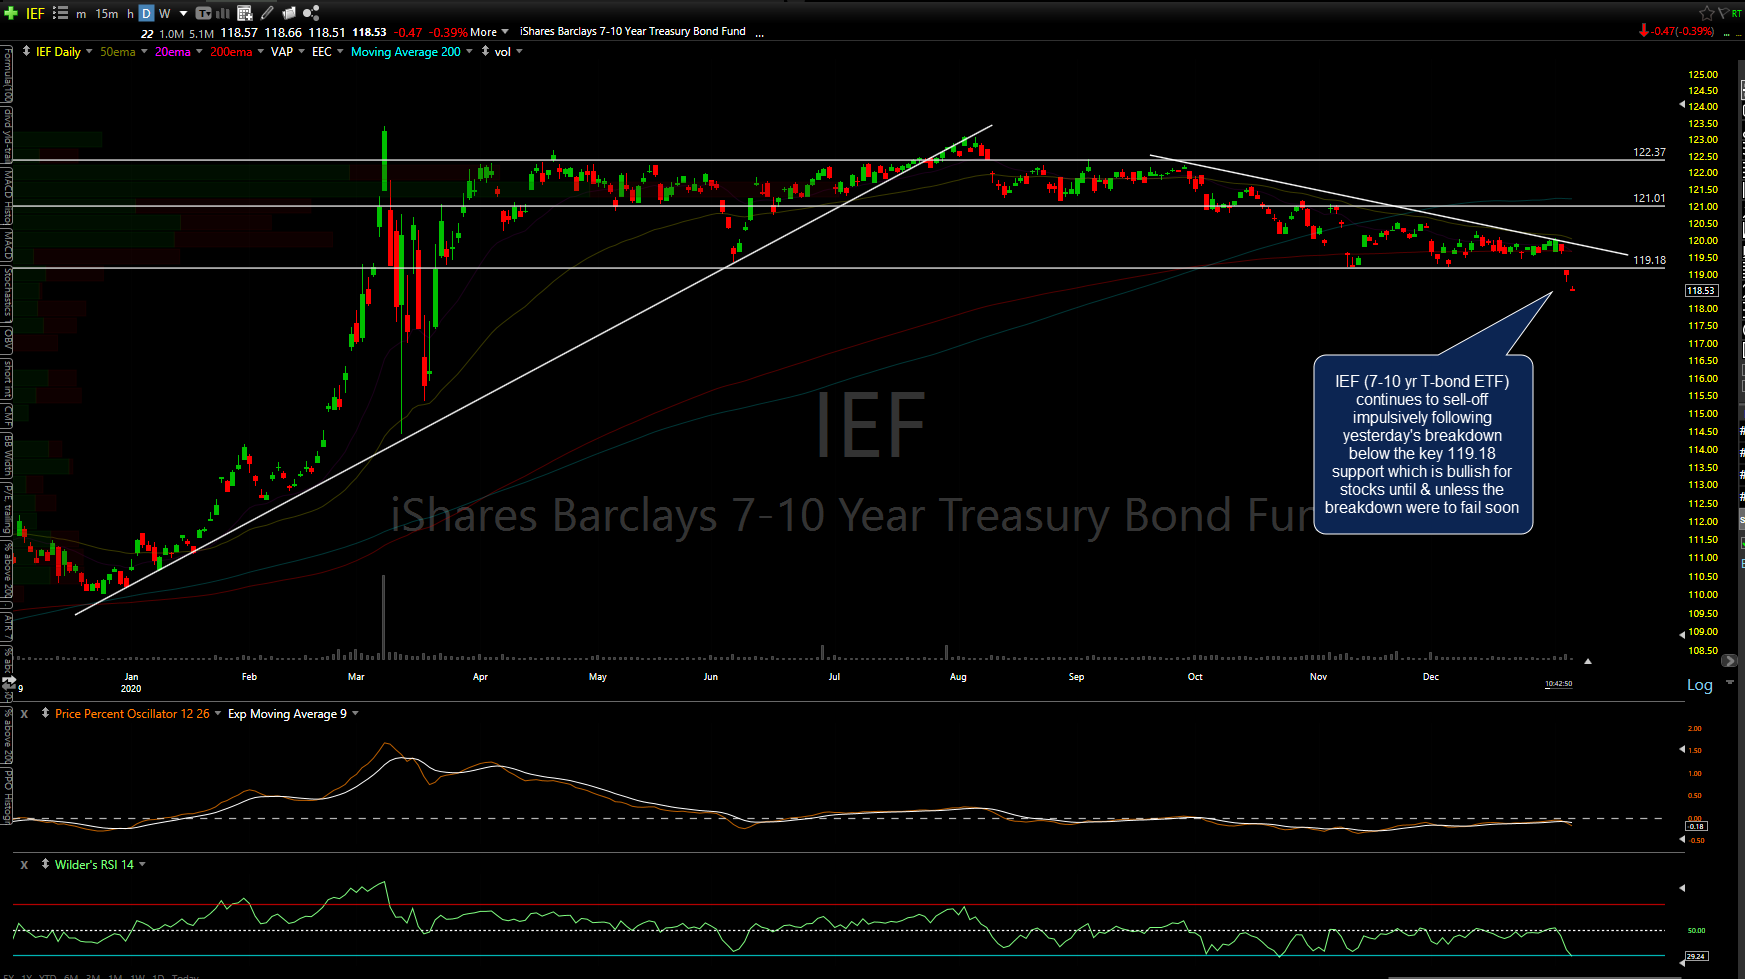
IEF daily Jan 7th
Likewise, /ZN (10yr T-bond futures) continues to drop impulsively following yesterday’s breakdown below the triangle pattern as money moves from safe-haven bonds to stocks. How soon before rumblings about the potential inflationary smoke signals the bond market is sending before talks of the Fed backpedaling on their “free-money for years to come!” stance? 120-minute chart below.

ZN 120m Jan 7th
Bottom line: As I like to say, a breakout is a breakout & as of now, the breakouts (breakdown) in Treasury yields (bonds) is about as convincing as it gets, with extremely impulsive selling in bonds (spike in rates). Likewise, SPY has foiled the 60-minute sell signals as well as moved back above Monday’s bearish engulfing candlestick without confirming that potential sell signal on the daily time frame.
Monday’s sell signals on the 60-minute charts of QQQ & /NQ haven’t yet been negated, as both are currently trading around where the first uptrend lines were taken out but not far above the previous highs with some strong upside momentum so far today. On the more significant daily time frame, QQQ failed to confirm Monday’s bearish engulfing candlestick as a sell signal with a solid break & close below it.
I’ll do a follow-up post or video on the stock indices later today if there are any significant developments from here. Otherwise, I’m working on updates for some of the recent trade ideas such as commodities, the agricultural input stocks, the energy stocks & commodities (coal, oil, & nat gas) as well as anything else that stands out.