
Here are the nearby supports on SPY & QQQ on the more significant daily time frames. The charts still indicate considerable more downside to come although, at this point, it’s just a matter of, “Where will the first decent counter-trend bounce start?” How the major stock indices act as they fall to each support will help to gauge the nature (supply/demand dynamics) of this market. If they just slice through these upcoming support levels as if they aren’t even there that indicated a very large imbalance of sellers (trapped long that want out in a bad way) to buyers.
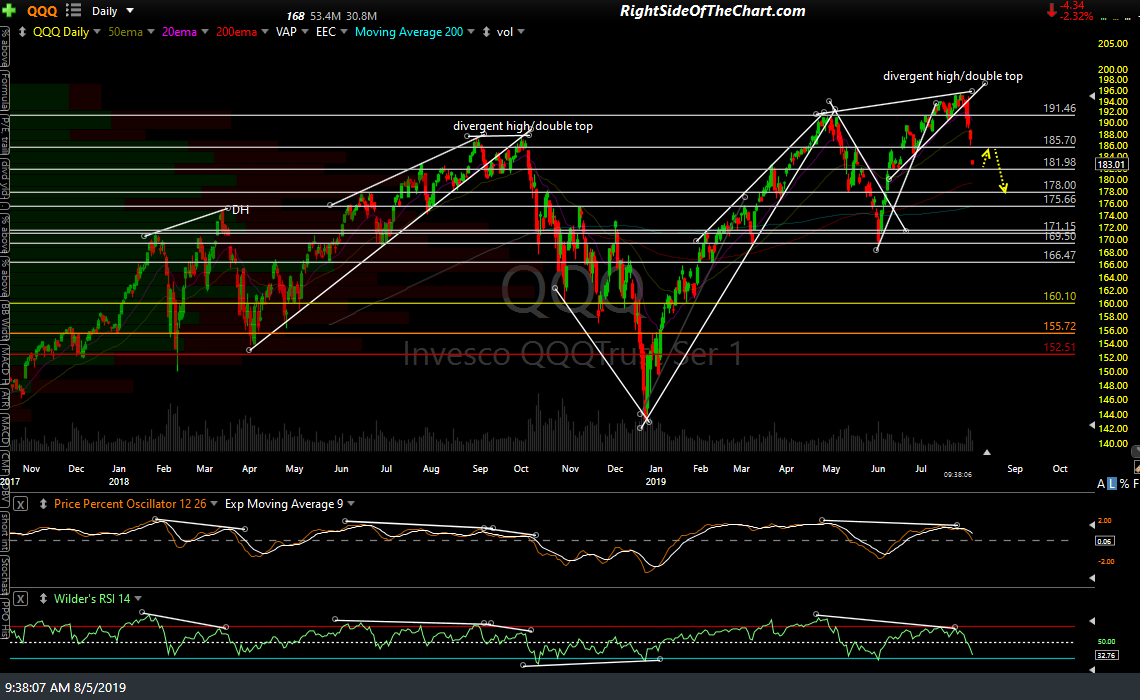
QQQ daily Aug 5th

SPY daily Aug 5th
Typical swing traders shouldn’t be overly concerned with trying to game any counter-trend bounces at this point as there are very little if any, developments in the charts that indicate the correction off the recent highs is over or close to being over. However, lowering stops to protect profits on swing short positions at this time would be prudent.
Active traders looking to cover shorts and/or position long for a bounce might want to look for any signs of a reversal on the intraday times frames such as bullish candlestick reversal patterns, ideally of or just below support; a near-term selling climax, divergences, etc.