
The breakout above the 60-min ascending triangle on /NQ earlier today was the catalyst for the rally that has now taken QQQ to resistance with SPY about 0.30% shy of the 279.50 resistance level. 120-minute charts:
-
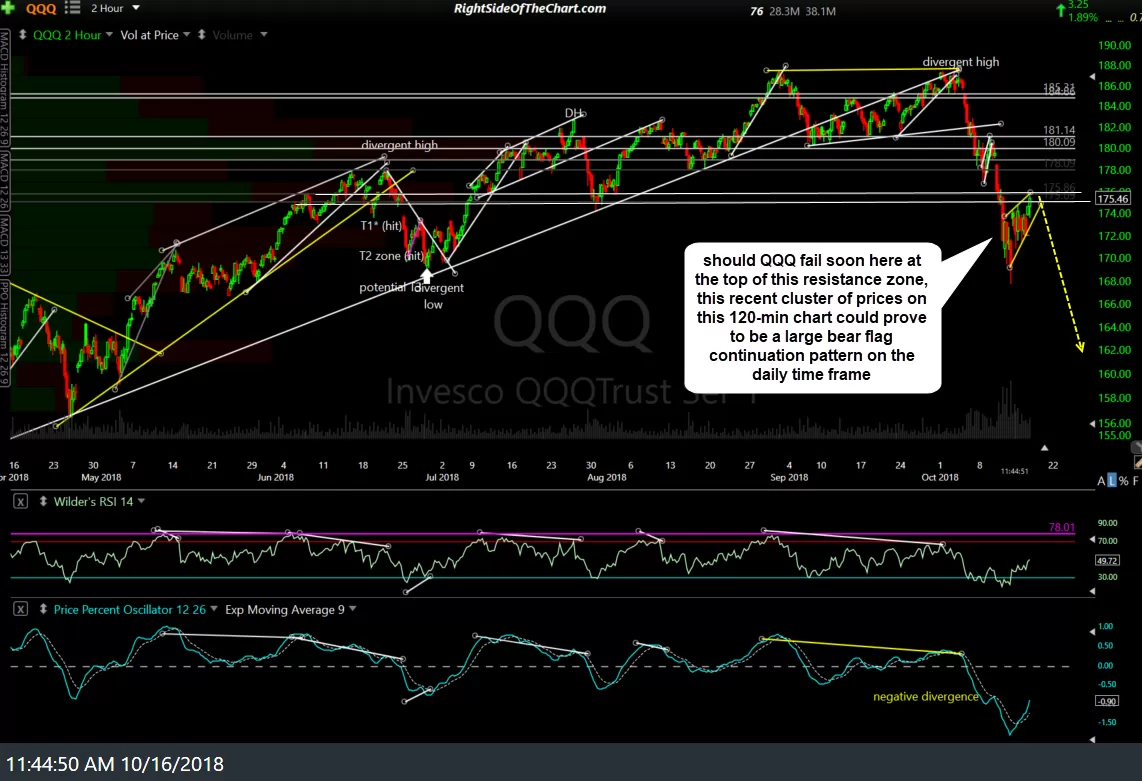
- QQQ 120-min Oct 16th
-
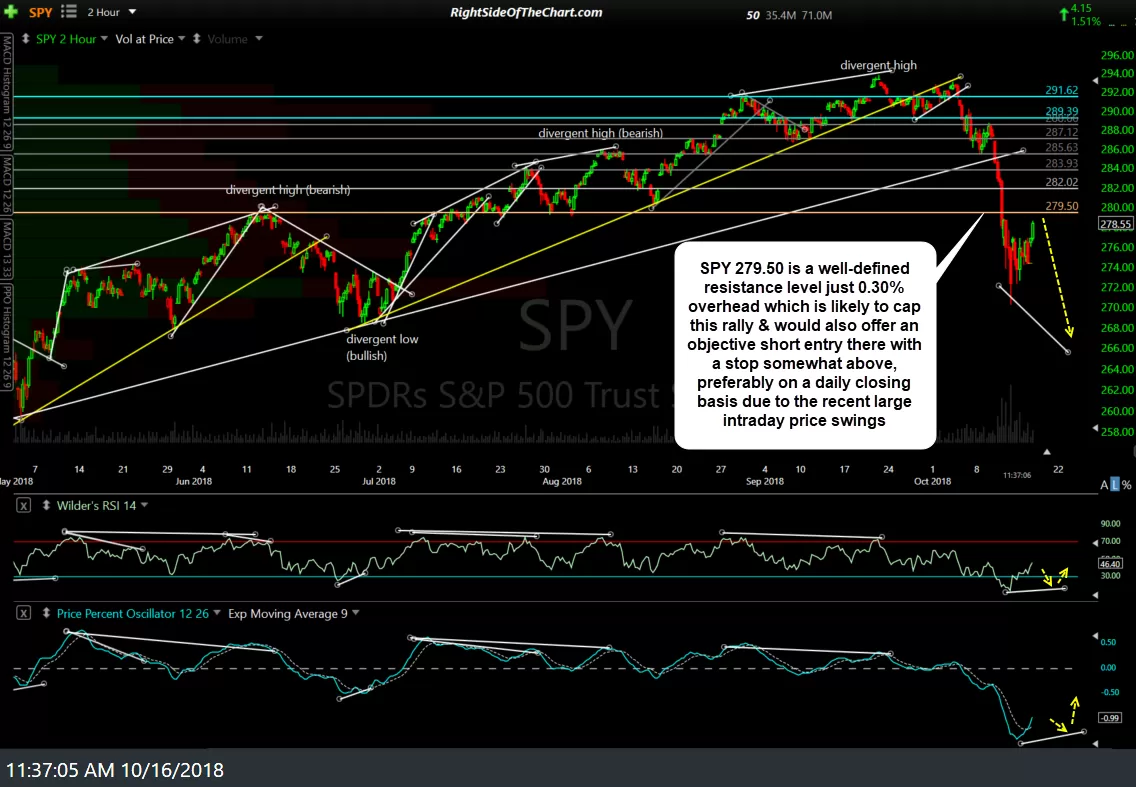
- SPY 120-min Oct 16th
Here’s the 15-minute chart of /NQ with the recently highlighted ascending triangle pattern which was taken out today. Will this breakout prove to be the real deal or a fake-out? Hard to say right now but with the major stock indexes facing some significant resistance overhead, this bounce up to resistance does appear to offer an objective short entry with stops somewhat above.
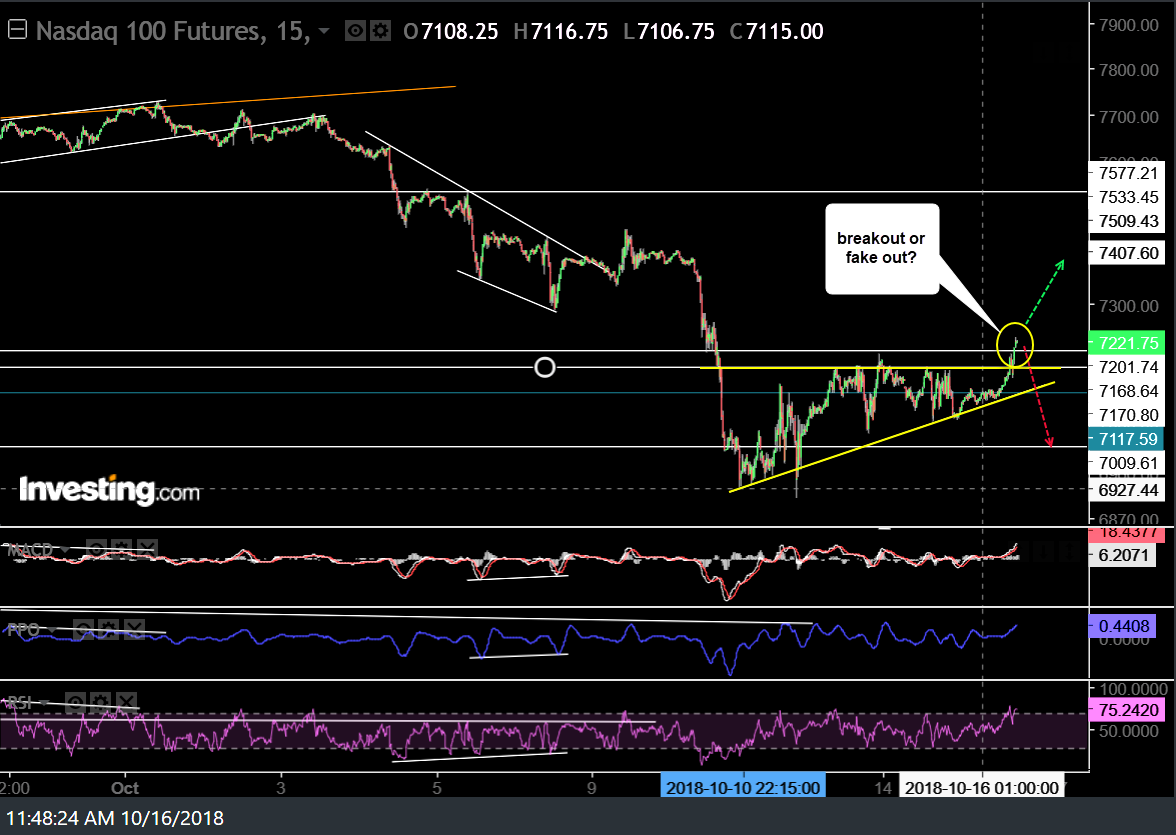
NQ 15-min Oct 16th
On a related note, I wanted to share the following chart & comments on QQQ that I posted in the trading room earlier today:
QQQ is under consideration as an official short trade but with the Q’s trading just above the key 200-day/40-week EMA as well as right on or slightly above the primary uptrend line off the mid-2015 lows (i.e.- QQQ still holding key support), coupled with the recent deep oversold readings, I still can’t rule out a more substantial bounce.
However, I wanted to pass along those targets (listed as the actual support levels on this chart, not yet adjusted for an optimal fill). My preferred swing target, should QQQ reverse soon, would be the 154 area, about 12% below current levels. That makes a short here on the bounce back to the 175ish resistance & trendline backtest (as per the draw on this chart) objective with a stop 2-3% above. The rate of failure for that trade is elevated since QQQ is trading on or above some key weekly supports so one could wait for some decent evidence of a reversal/failure soon before shorting or even go long here with a stop not too far below for what might prove to be a multi-week rally.
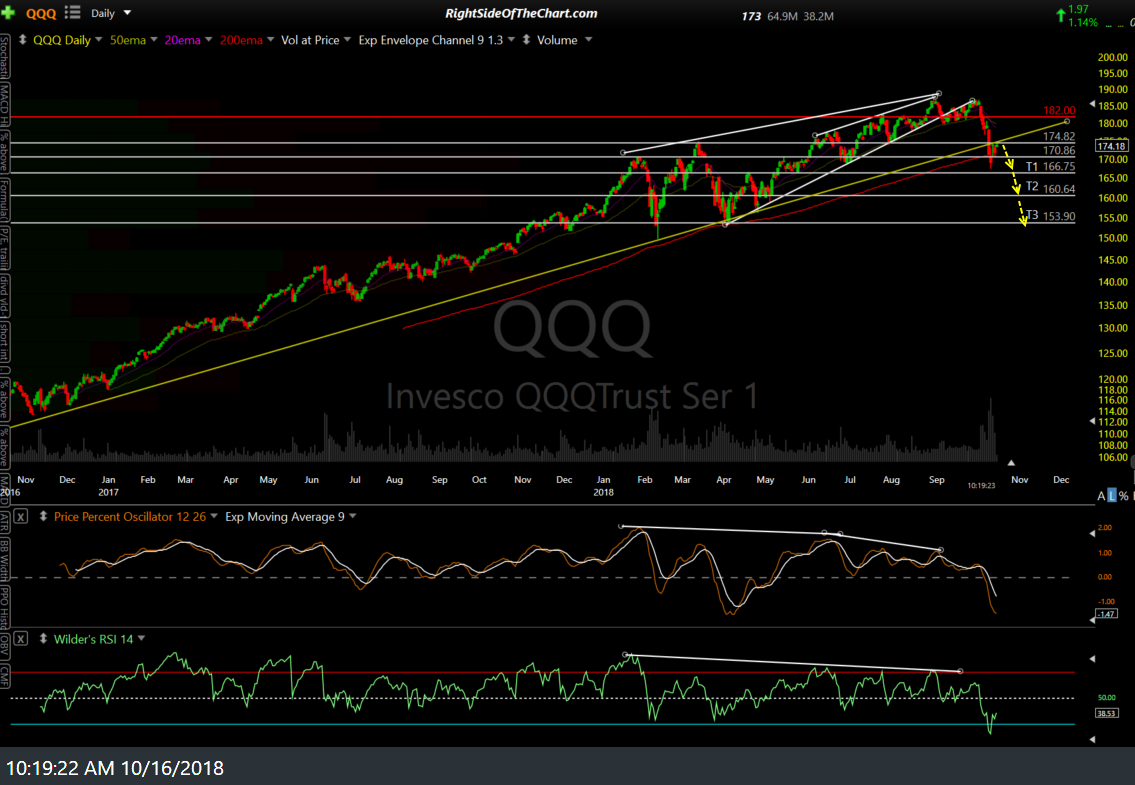
QQQ daily Oct 16th