
With /NQ so far reversing off the 11150ish target/support level posted earlier today, I wanted to follow up with the charts of the S&P 500 & Russell 2000 trading proxies (ETFs & futures). As with /NQ, strong but still unconfirmed, positive divergences continue to build on /ES as it tests the 3357ish support with the 3325 support just below.

ES 60m Sept 8th
SPY made a momentum-fueled overshoot of my 340 price target on Friday to reverse off the 335.12ish minor support level with a second reaction off that level so far today. Previous (Sept 2nd) & updated 60-minute charts below.

SPY 60m Sept 2nd
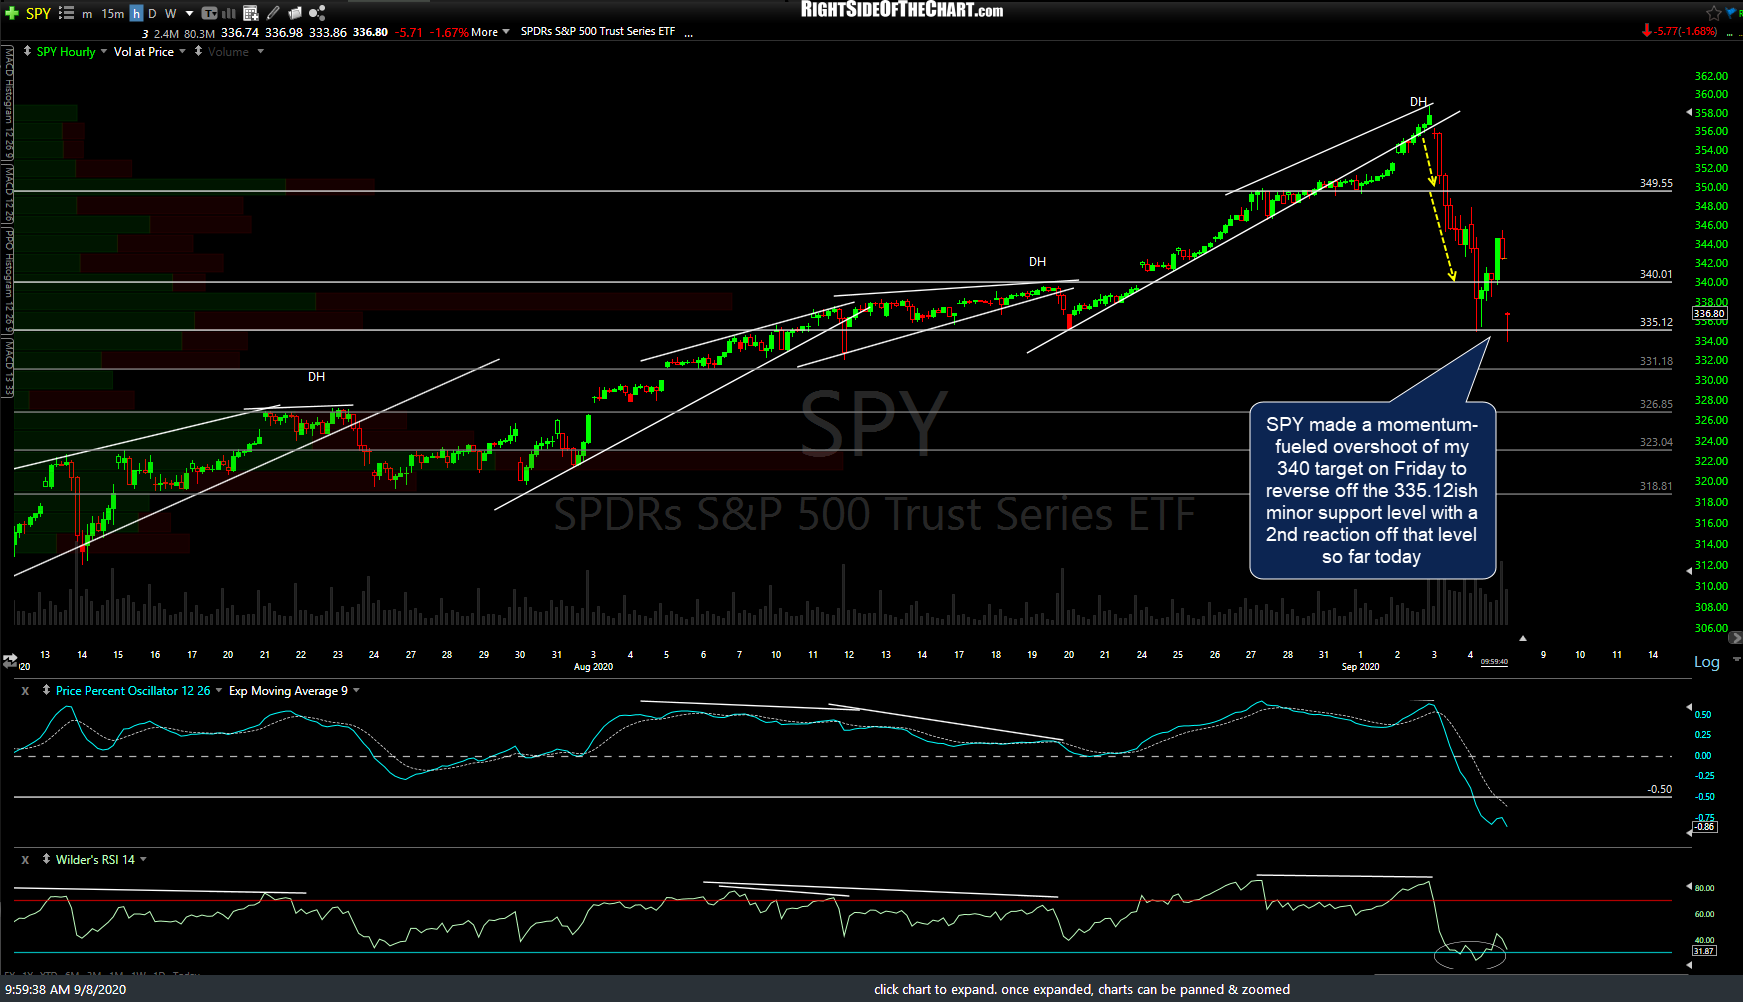
SPY 60m Sept 8th
SPY closed below the daily uptrend line on Friday albeit by a relatively small margin but has so far followed through on that sell signal with additional downside so far today. Next support/target remains 326.70 although a backtest & even possibly a recovery of the trendline still can’t be ruled out at this time.
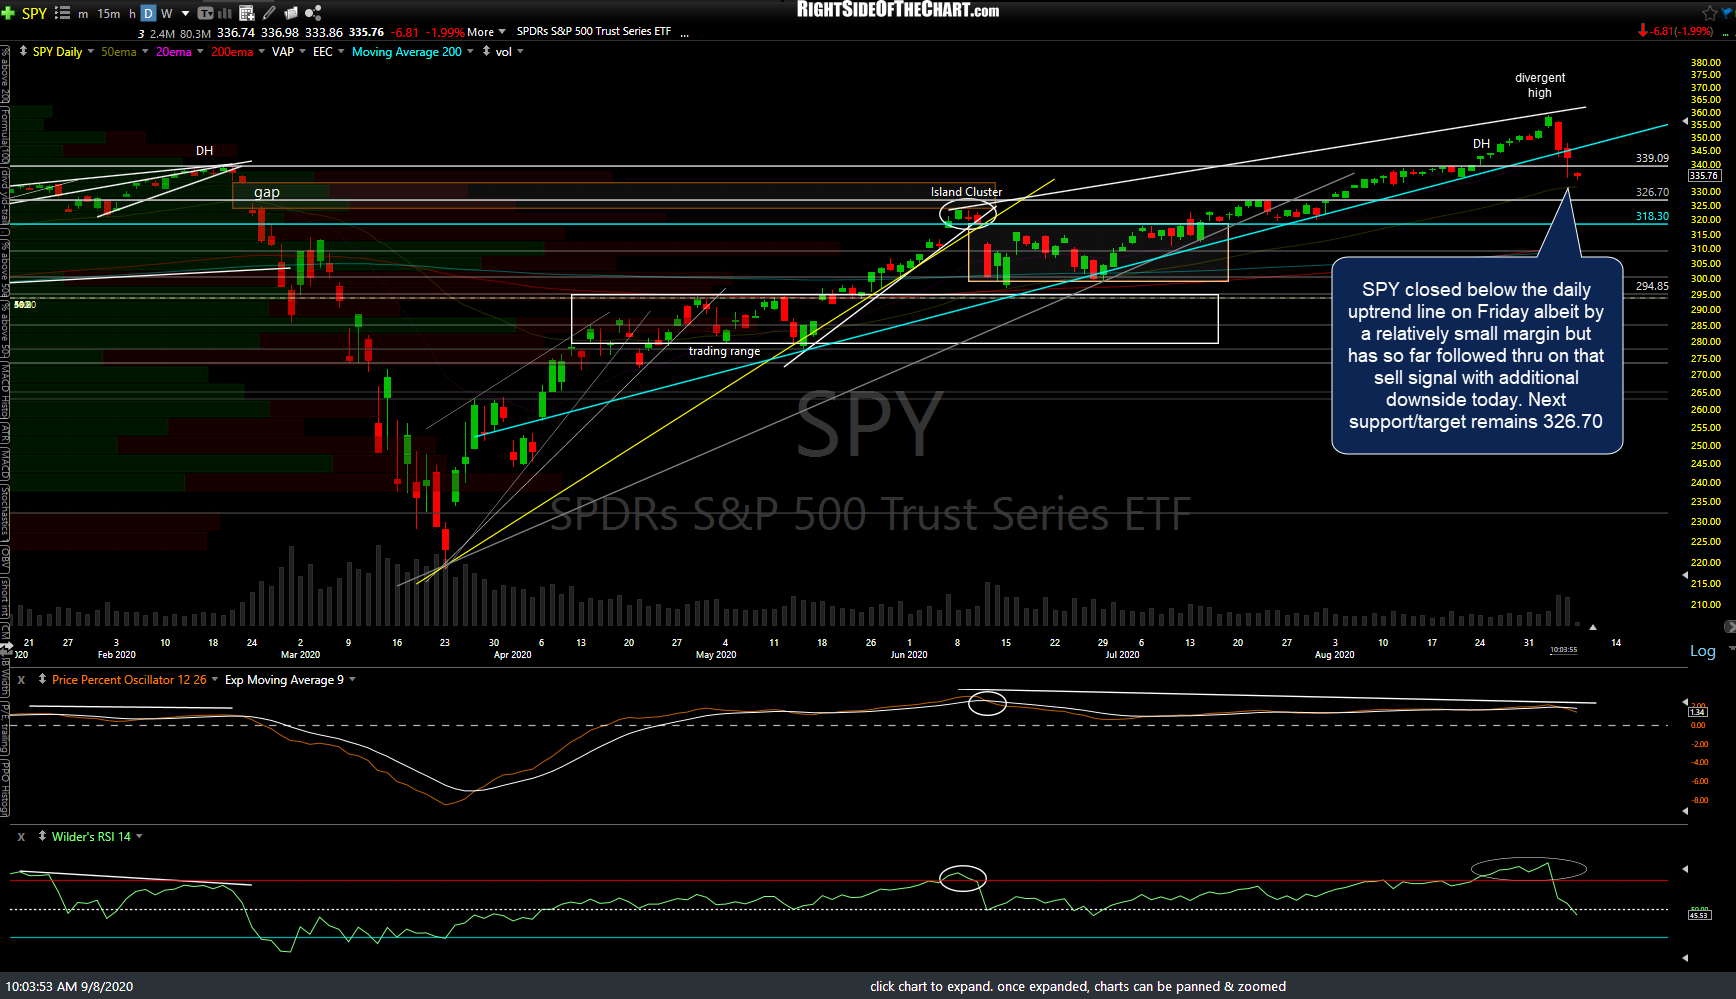
SPY daily Sept 8th
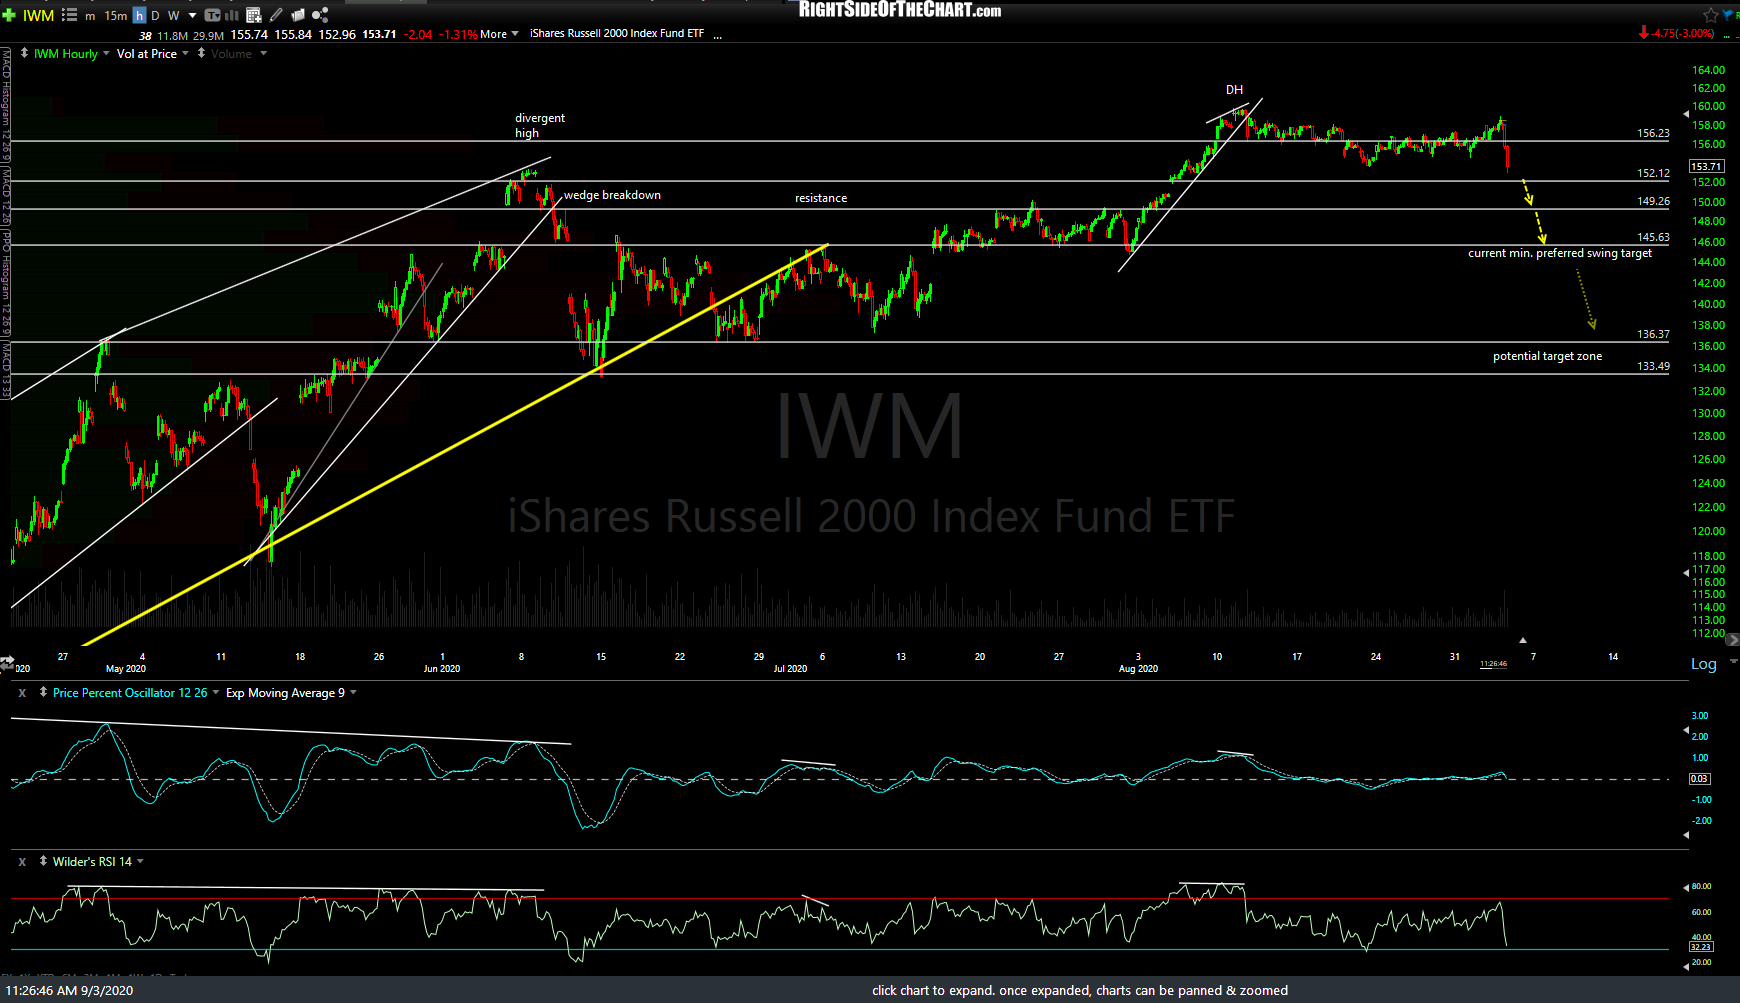
IWM has made another successful test of the 149.26 price target/support level after hitting & bouncing off it on Friday. Previous (Sept 3rd) and updated 60-minute charts below.
IWM 60m Sept 3rd.png

IWM 60m Sept 8th
/RTY is making a 2nd test of the 1494.30 price target/support level with potential bullish divergences forming on the RSI & PPO. Previous (Aug 12th) and updated 60-minute charts below.
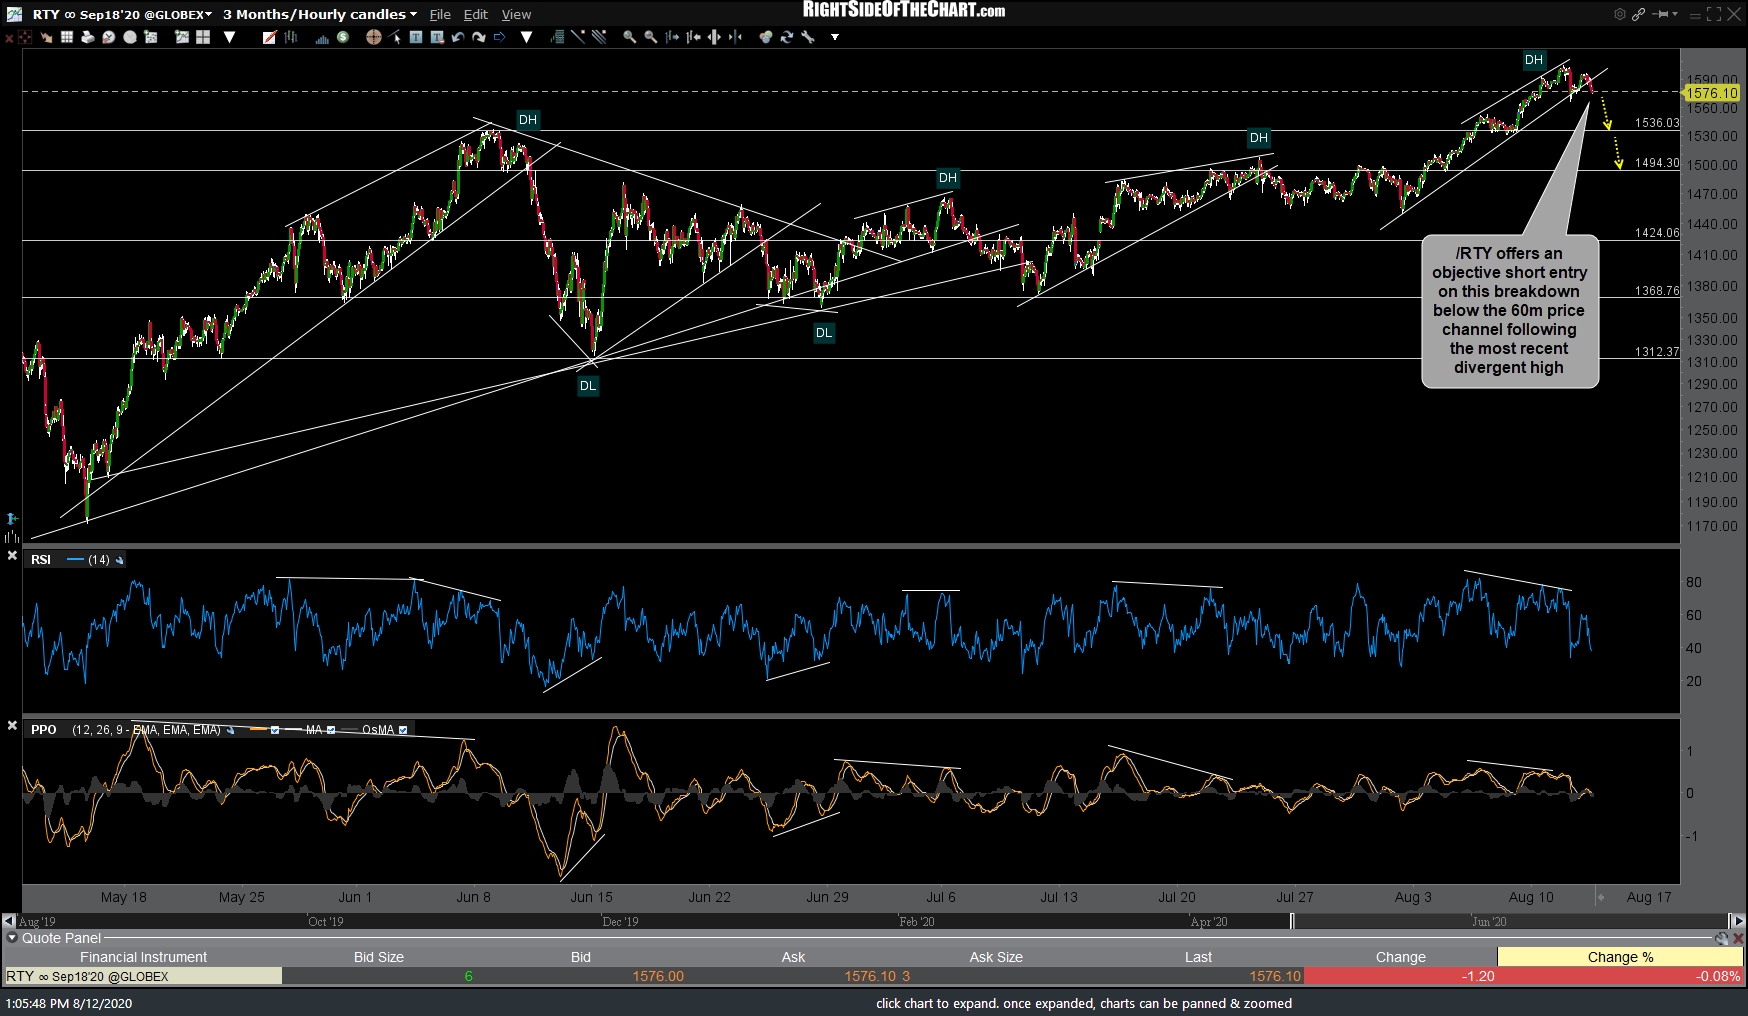
RTY 60m Aug 12th
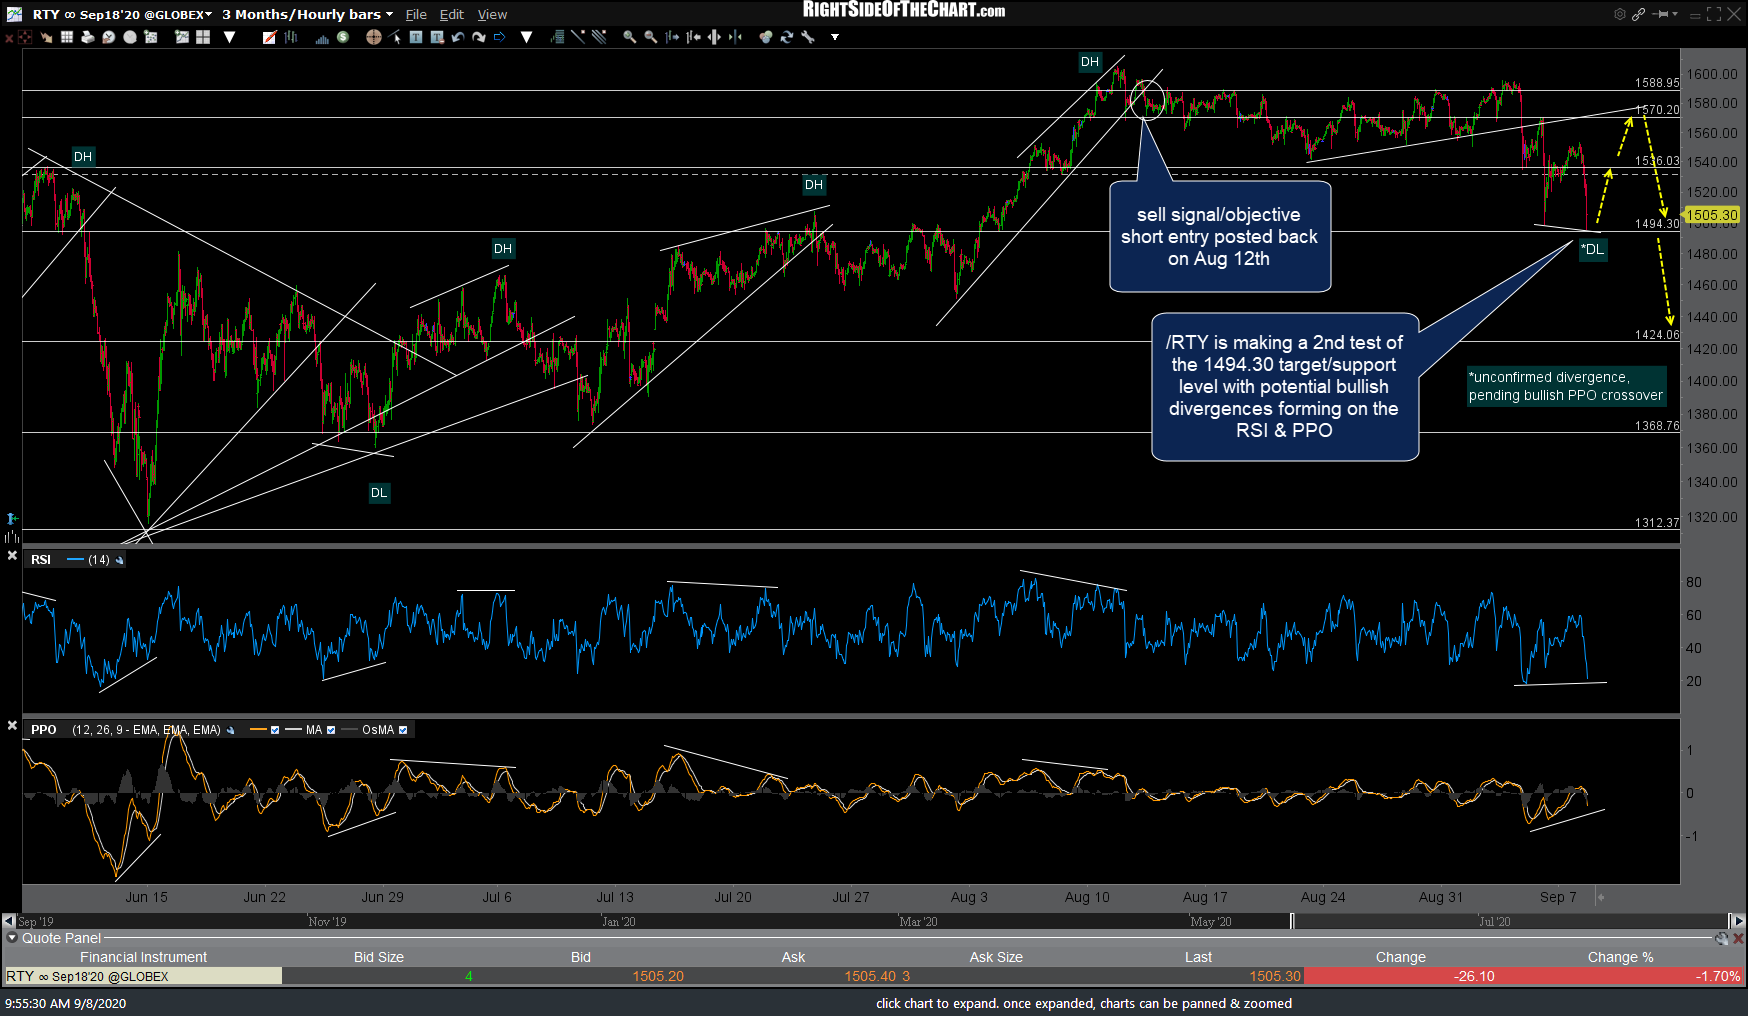
RTY 60m Sept 8th
Bottom line: So far, the major stock indices ($NDX, $SPX, & $RUT) have fallen to & held significant support levels while deeply oversold on the short-term time frames with potential bullish divergences building on the 60-minute futures charts. As such, the odds for a tradable bounce continue to increase until & unless these support levels & the potential divergences are clearly taken out. At this time, it looks like a near-term & tradable bounce, followed by another leg down later this week is a likely scenario although I will continue to monitor the charts closely & do my best to pass along any significant developments that I notice asap.
With both QQQ & SPY trading below the daily uptrend lines, I’m also quite eager to see how both finish the day. As of now, we have the long-awaited sell signals on the more significant daily charts in play with SPY & QQQ below those trendlines & until & unless both can close back above those trendlines, less-active traders might opt to use rallies back to resistance as objective shorting opps and/or to unload long positions. I also believe that last Monday’s highs in TSLA & APPL (the day of their stock splits) remains a technically significant level. As of now, all the retail traders that bought those over-owned & over-loved (not to mention, over-valued) stocks on the split are solidly underwater.
Although it is not my preferred scenario, a solid move above last Monday’s highs in AAPL & TSLA would be quite bullish for the market (unless met with strong selling shortly afterward). Based on the recent extremes on the various sentiment indicators, such as the put-to-call ratios, that I’ve highlighted in recent weeks, coupled with the technical posture & recent developments on the daily & weekly charts, it appears that a significant-top was likely put in last week with more downside to follow in the coming weeks, with the typical counter-trend rallies along the way.
Should the major stock indices fail to hold the support levels tested so far today (or those just below) with the current divergences on the futures failing to result in a tradable rally, that would be quite bearish IMO with more impulsive selling likely this week. At this time, I’m near-term (hours to a few days) cautiously bullish while intermediate-term (weeks+) bearish.