
Breakout of fakeout? SPY gapped above the post 6/11 sell signal trading range. Should it hold & build on this morning’s gains, that would be bullish while a drop back below 311 would be bearish (false breakout). Daily chart below.
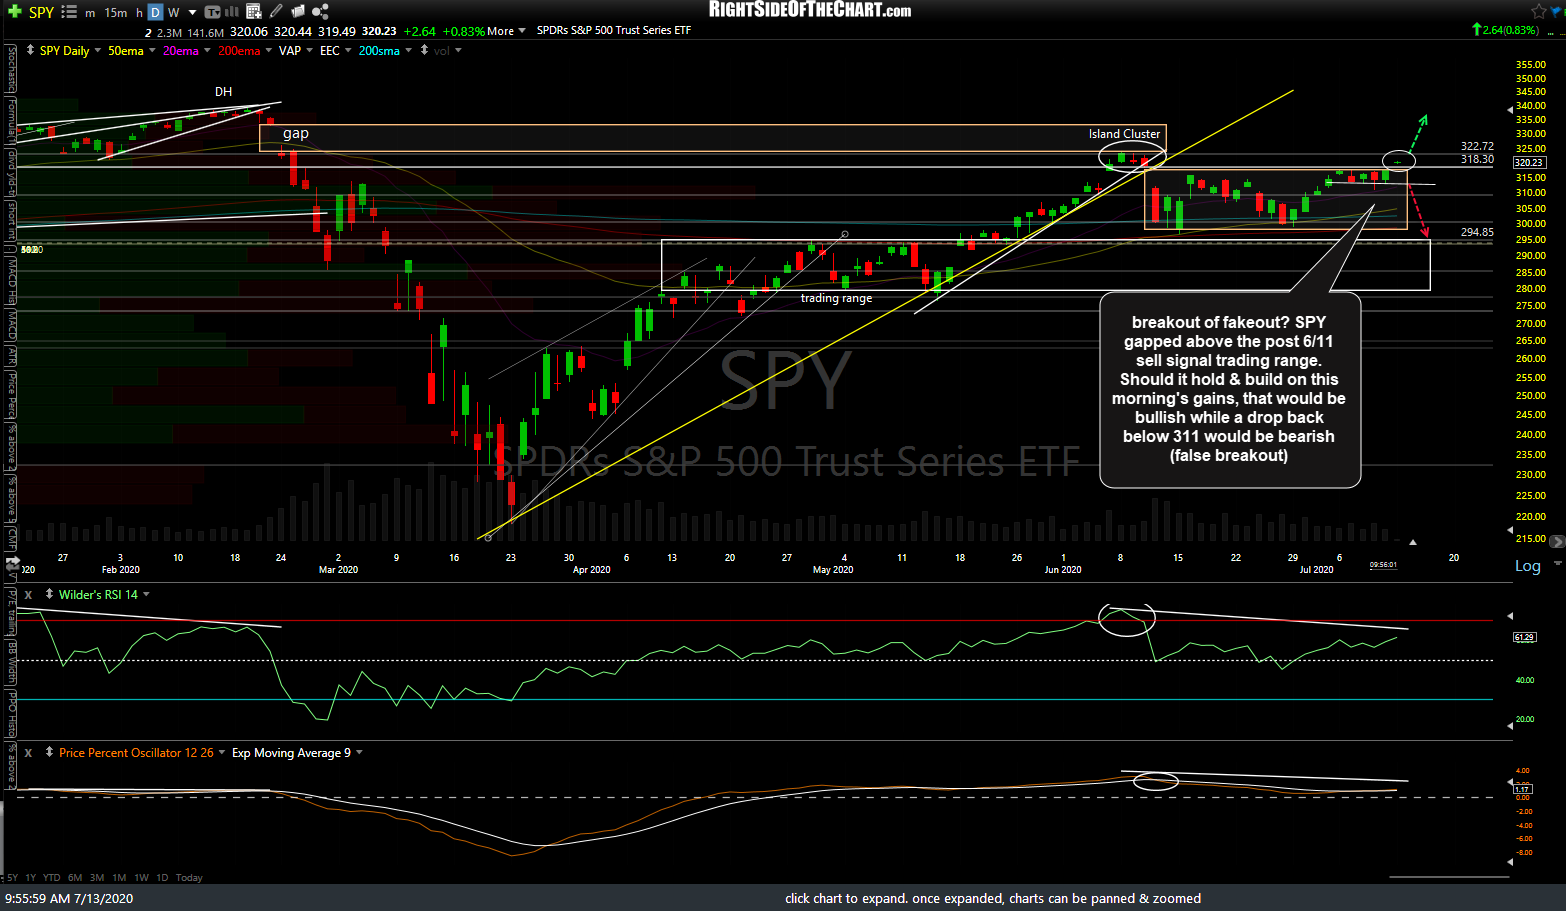
SPY daily July 13th
Breakouts that occur with both negative divergences, as well as overbought conditions, such as SPY has on the 60-minute chart below, have a much higher rate of failure than do breakouts that occur without divergences or overbought conditions.
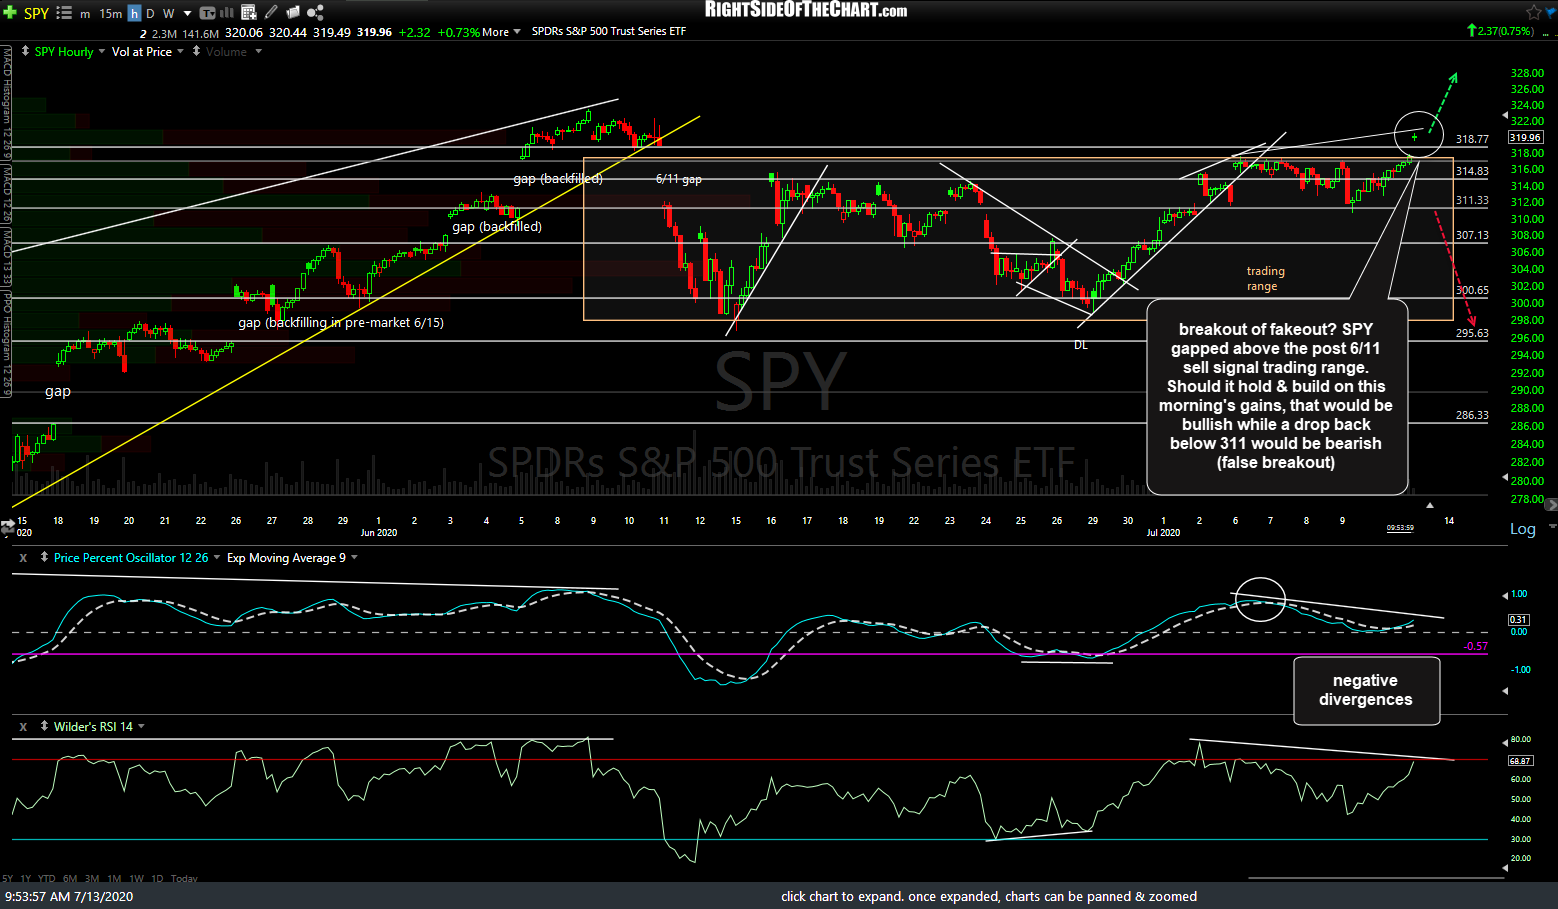
SPY 60m July 13th
Worth noting is the fact that unlike SPY, DIA (Dow Jones Industrial Average) remains within the post 6/11 sell signal trading range with it’s Island Top sell signal still intact for now.
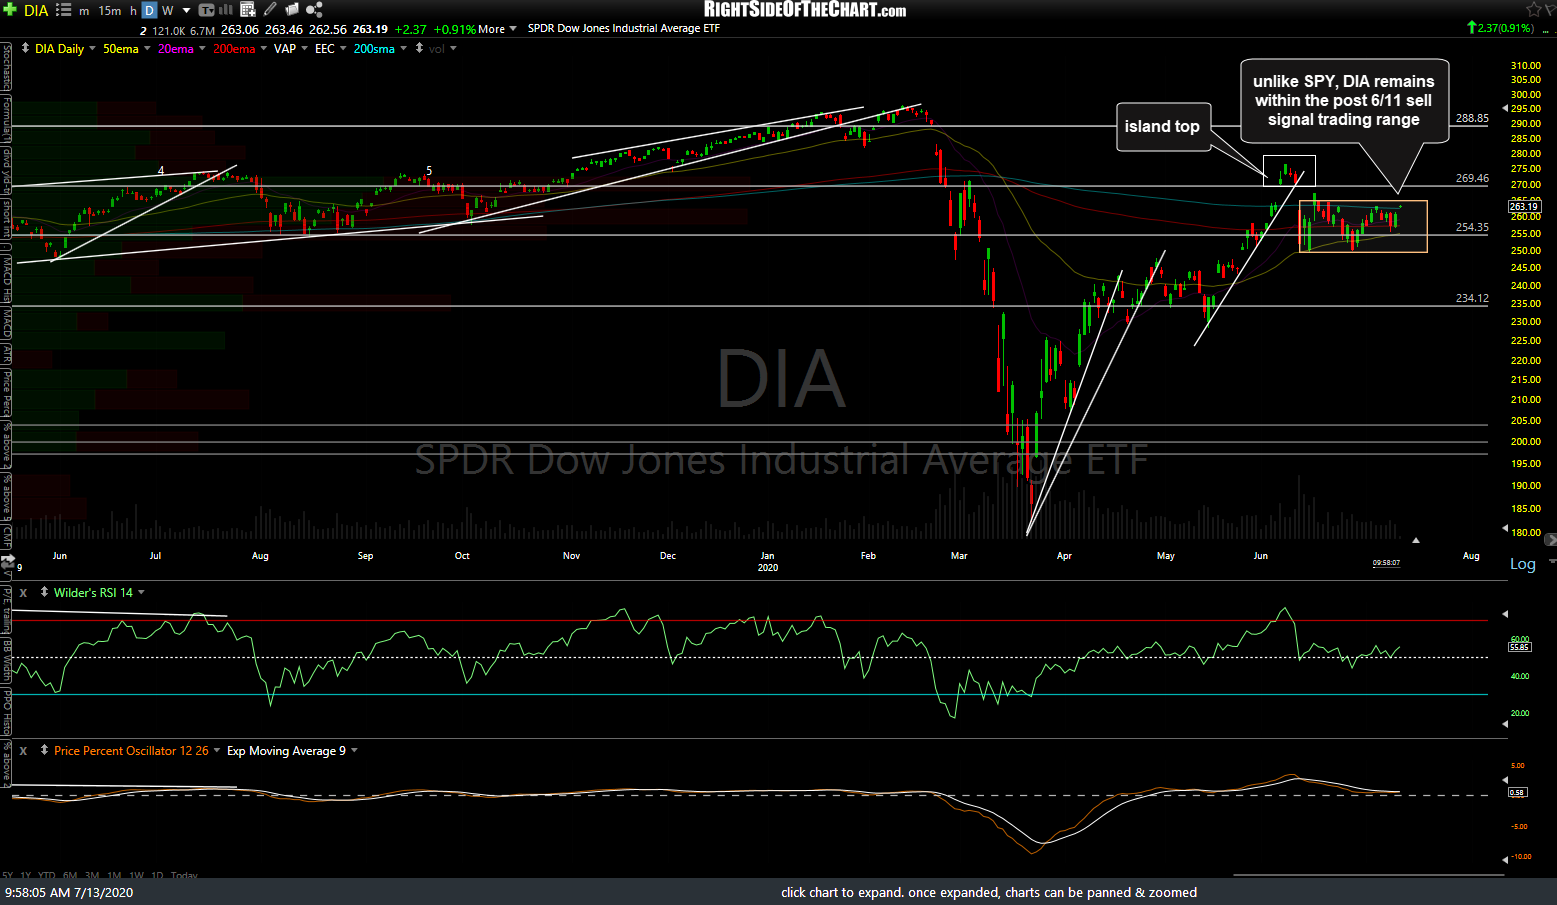
DIA daily July 13th
Likewise, IWM (Small Cap Index) remains below the key 145-146 resistance as well as the recent trading range.
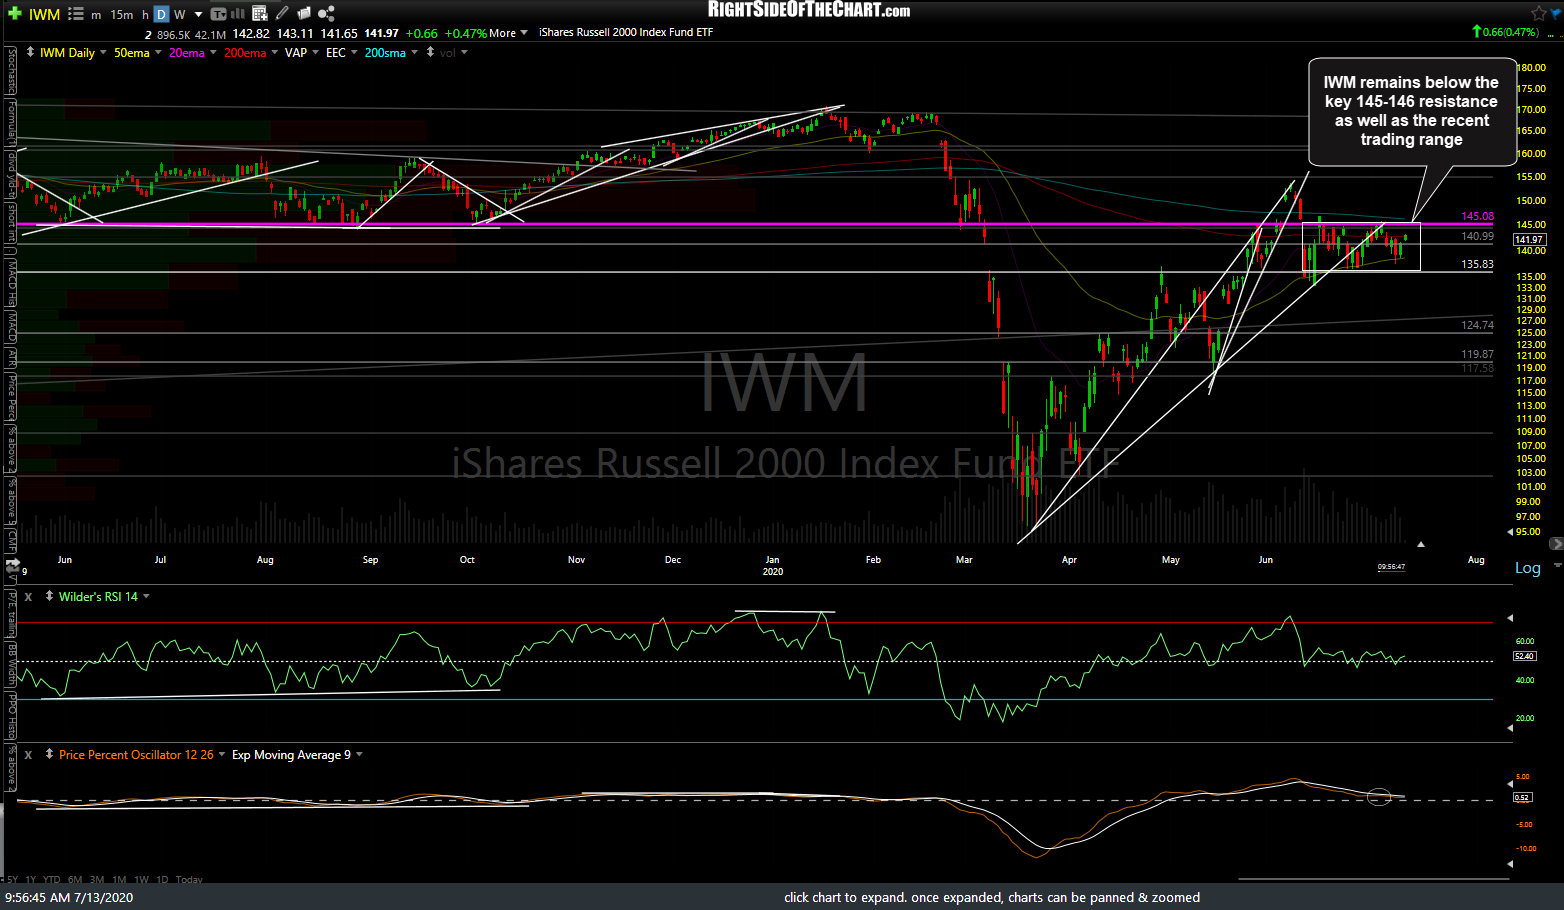
IWM daily July 13th
QQQ continues to do its own thing with negative divergences building on this 60-minute chart with a series of corrections following the previous divergent highs in recent months, all of which were followed by corrections of approximately 5%. Also, note the RSI is approaching the extreme 78.30 level which has preceded corrections in recent months.
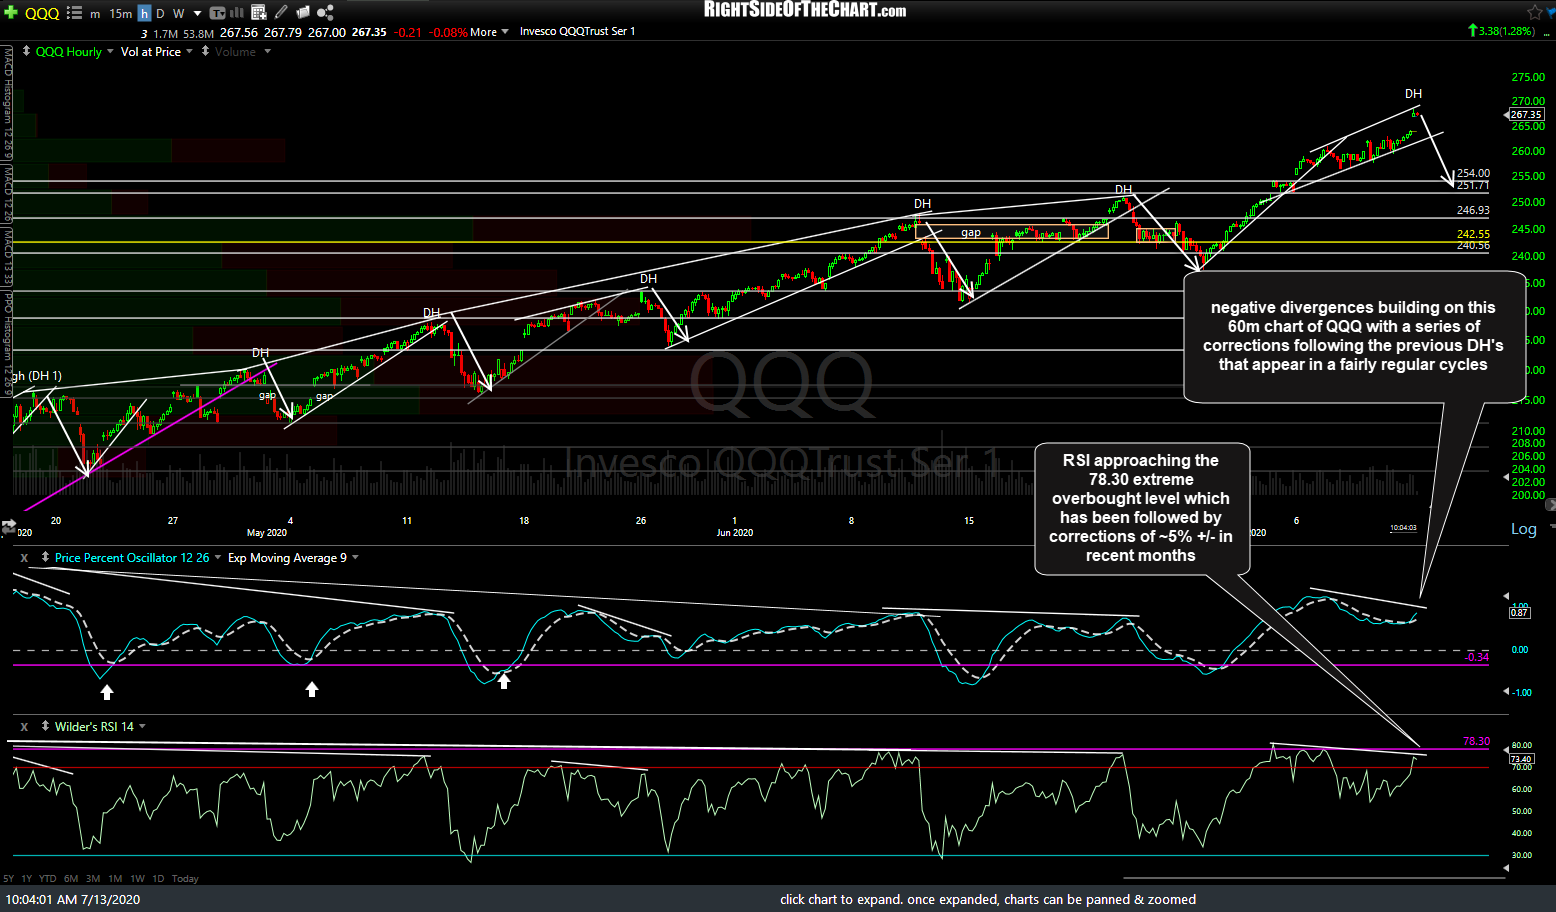
QQQ 60m July 13th