
As discussed in yesterday’s video, the breakdown on the/NQ (Nasdaq 100) 60-minute chart would have limited downside until & unless /ES (S&P 500) also took out the 3520 support with conviction. /ES successfully held & bounced off that level, thereby resulting in a bounce in /NQ as well. A sell signal would still come a solid break and/or 60-minute close below 3520.
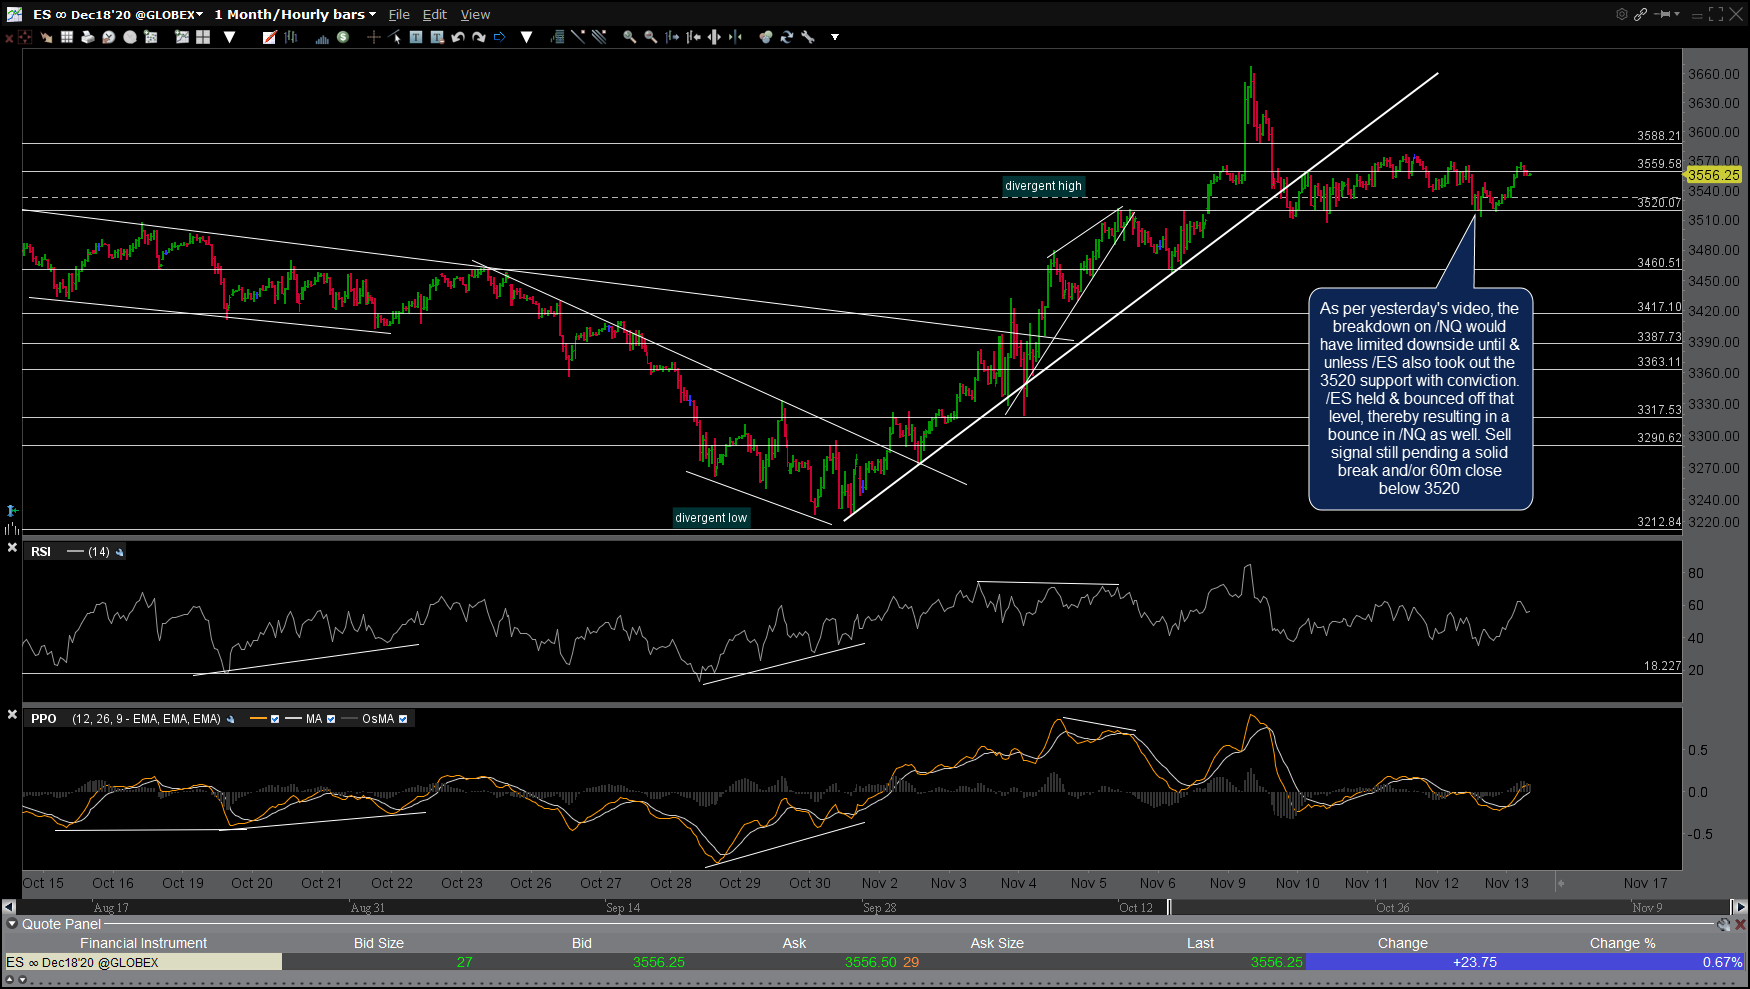
ES 60m Nov 13th
This is another good example of why one should closely monitor both the S&P 500 as well as the Nasdaq 100 when trading either or as a buy or sell signal in one is likely to fail if the other major large-cap index ends up bouncing off support or resistance around the same time. While yesterday’s sell signal on /NQ was not confirmed with a sell signal on /ES, it hasn’t been completely negated yet either. Should /ES go on to break below 3520, watch for a bearish cross below the zero line on the 60-minute PPO signal line of /NQ, which would indicate that the near t0 intermediate-term trend has flipped from bullish to bearish.
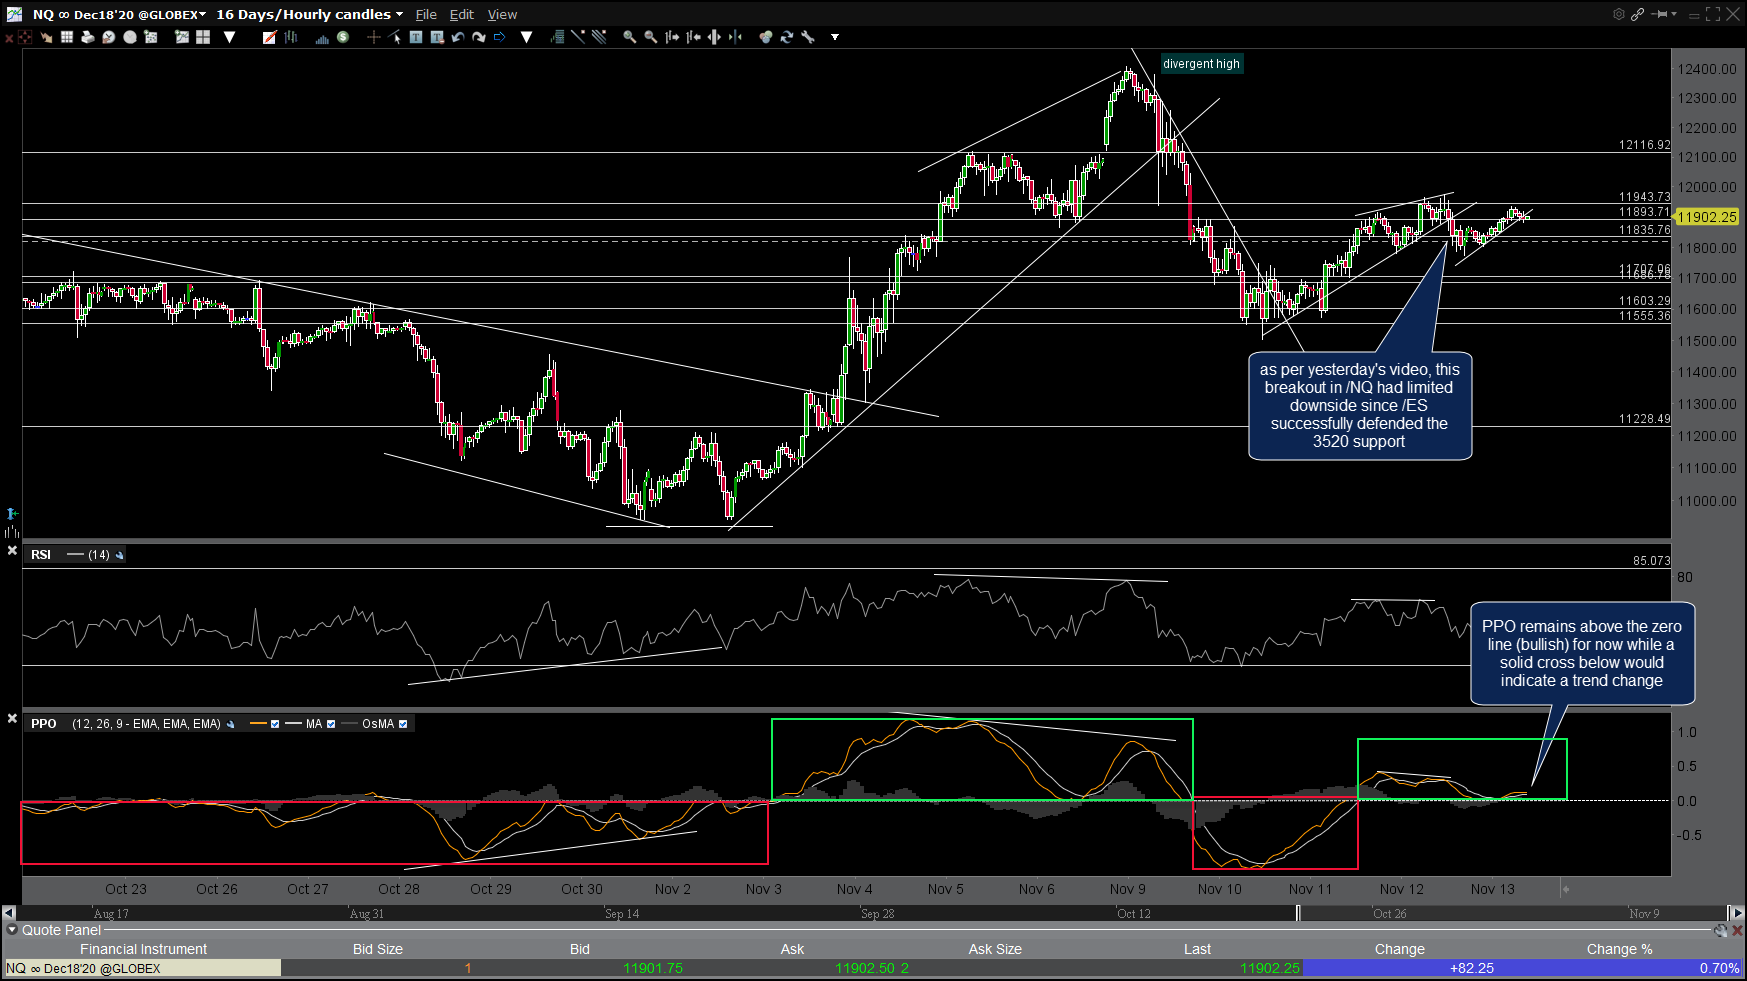
NQ 60m Nov 13th