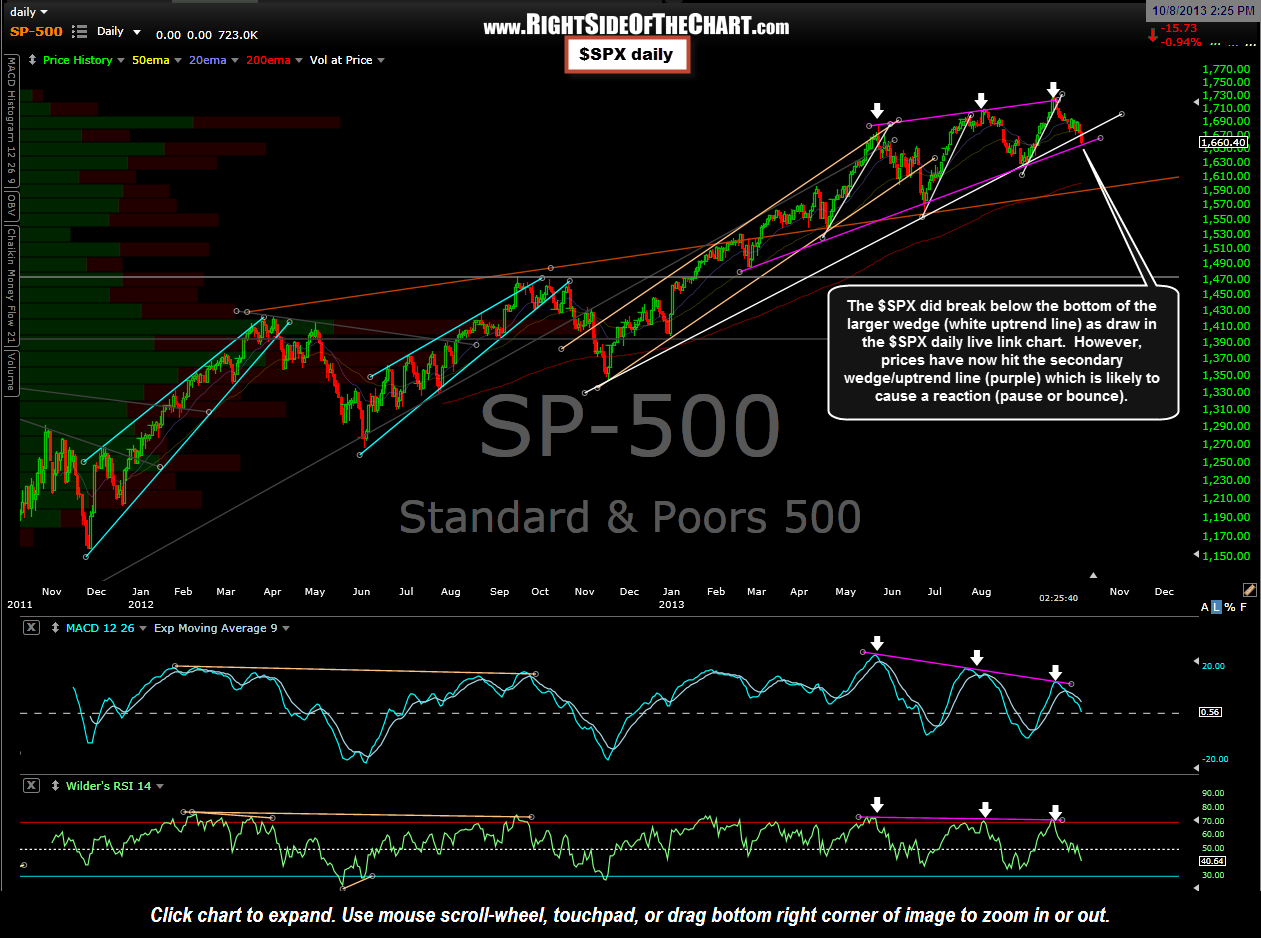
The $SPX did break below the bottom of the larger wedge (white uptrend line) as draw in the $SPX daily live link chart & updated daily chart posted early today. However, prices have now hit the secondary wedge/uptrend line (purple) which is likely to cause a reaction (a reaction being defined as a pause or short-lived bounce). This is the same pattern that was covered in the $SPX video analysis on Sept 26th (which can be viewed by clicking here). The updated version of that $SPX daily chart is shown here. My expectation is that any counter-trend bounce, regardless of how high it goes (e.g.-news of forward progress on the gridlock in DC could spark a relief rally) would be very temporary (hours or just a day or two) and might provide an opportune short entry or add-on.
It’s also worth mentioning that the $NAAD trend indicator is very close to triggering a sell signal as well. The static chart is posted below (although only end-of-day closing values count on this indicator) and a link to this indicator has now been added to the Live Chart Links widget on the sidebar of the homepage.


