
A near-perfect tag of the top of the first target zone on the SPY 60-minute chart with roughly coin-toss odds on whether we get a tradable bounce from here (followed by another leg down) or not. Any bounce back to (just shy) of the 410.39 support would offer another objective short entry or add-on. Previous (May 11th) & updated 60-minute charts below.
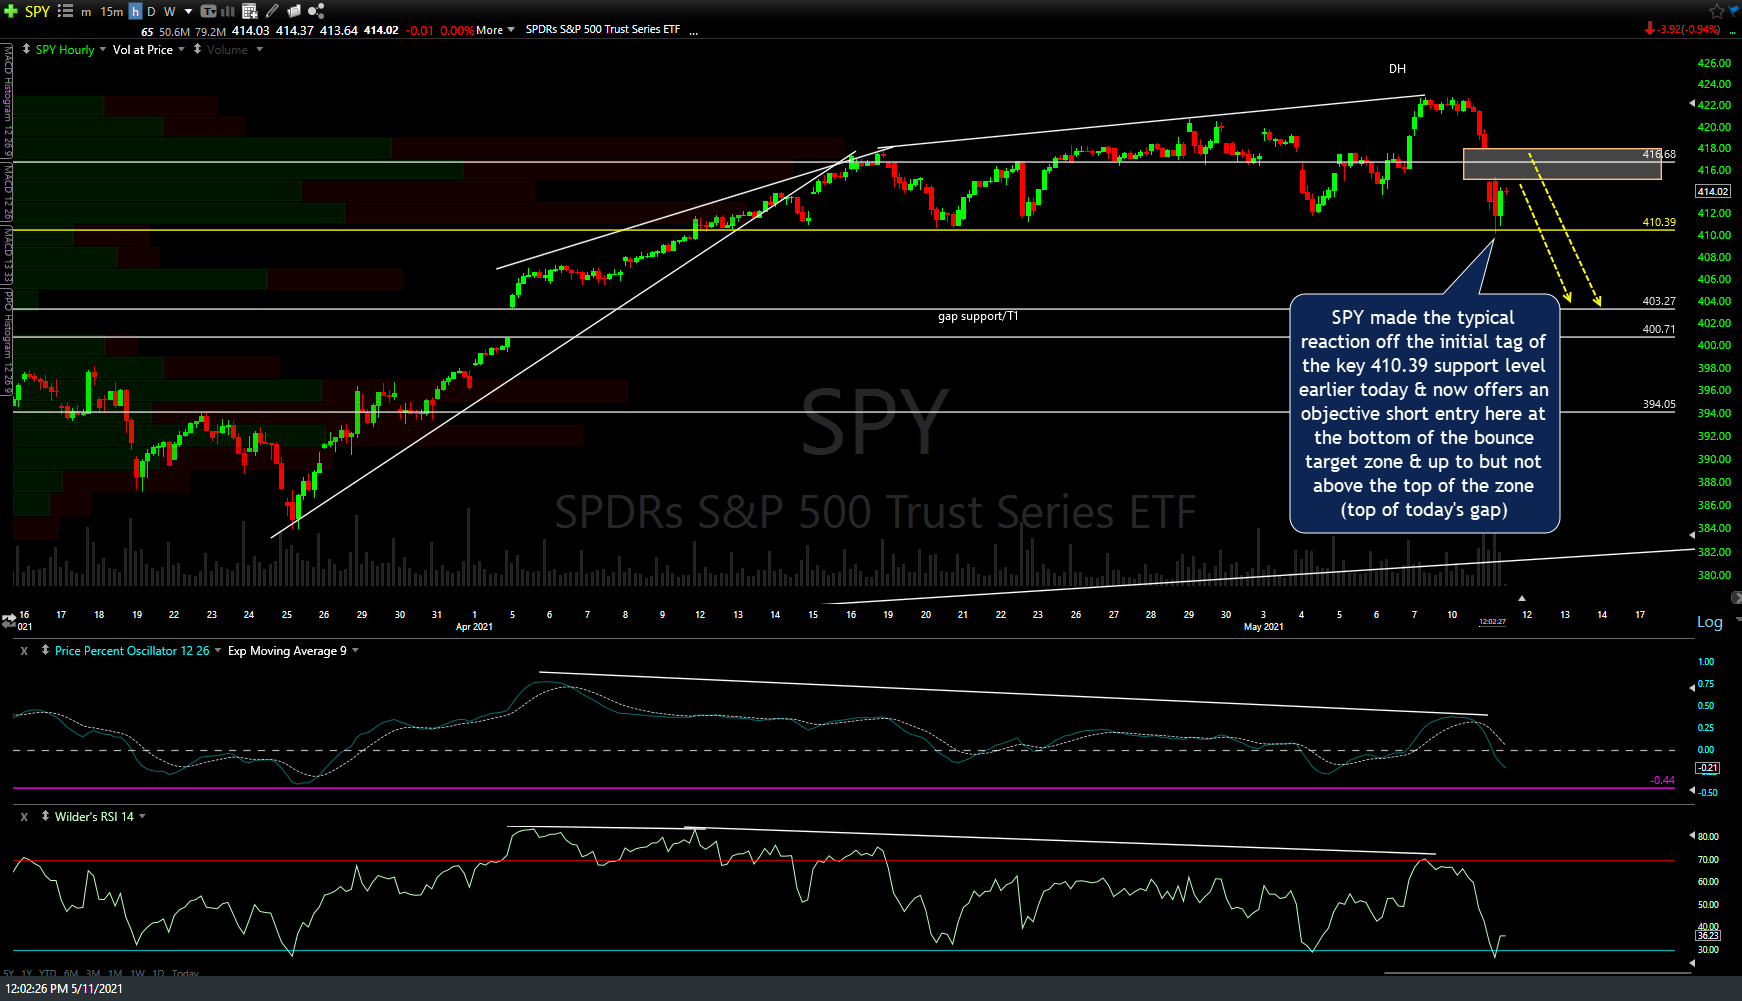
SPY 60m 2 May 11th
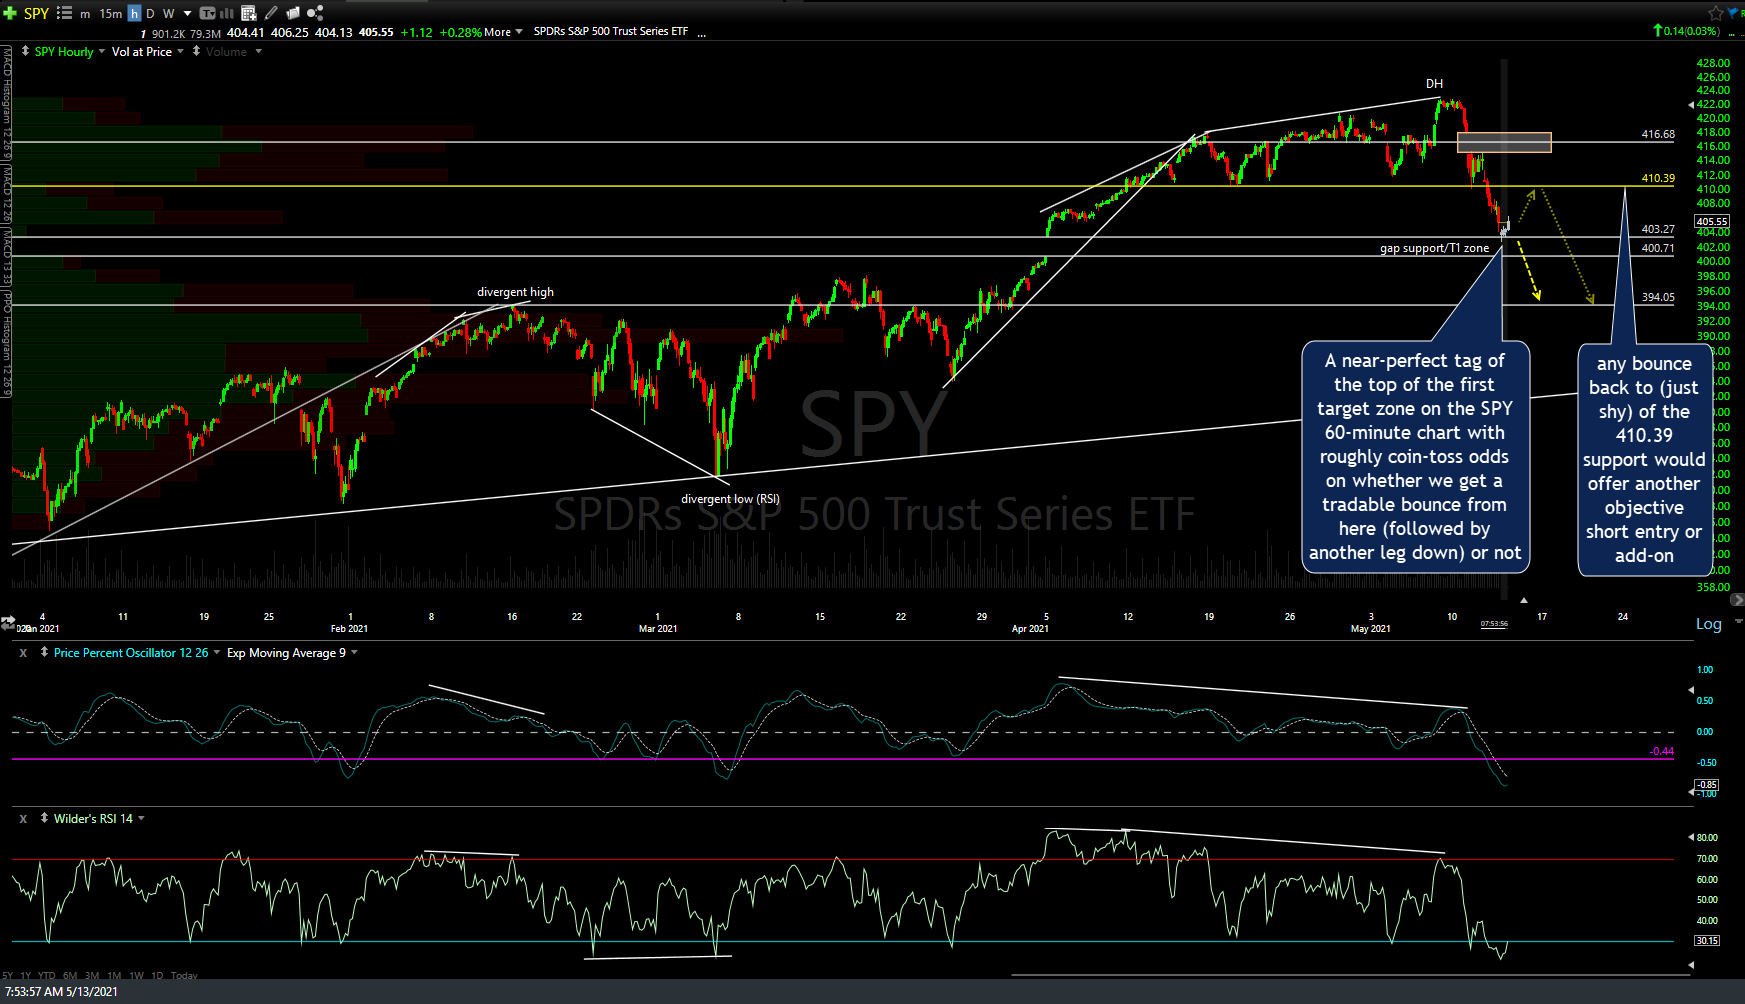
SPY 60m May 13th
/ES hit the 4055 price target late yesterday & has been trading around that support level since (i.e.- the typical reaction following the initial tag of a price target). Although a tradable bounce is still possible, I continue to favor more downside to at least the next price target soon, quite likely today. Previous (May 4th) and updated 60-minute charts below.
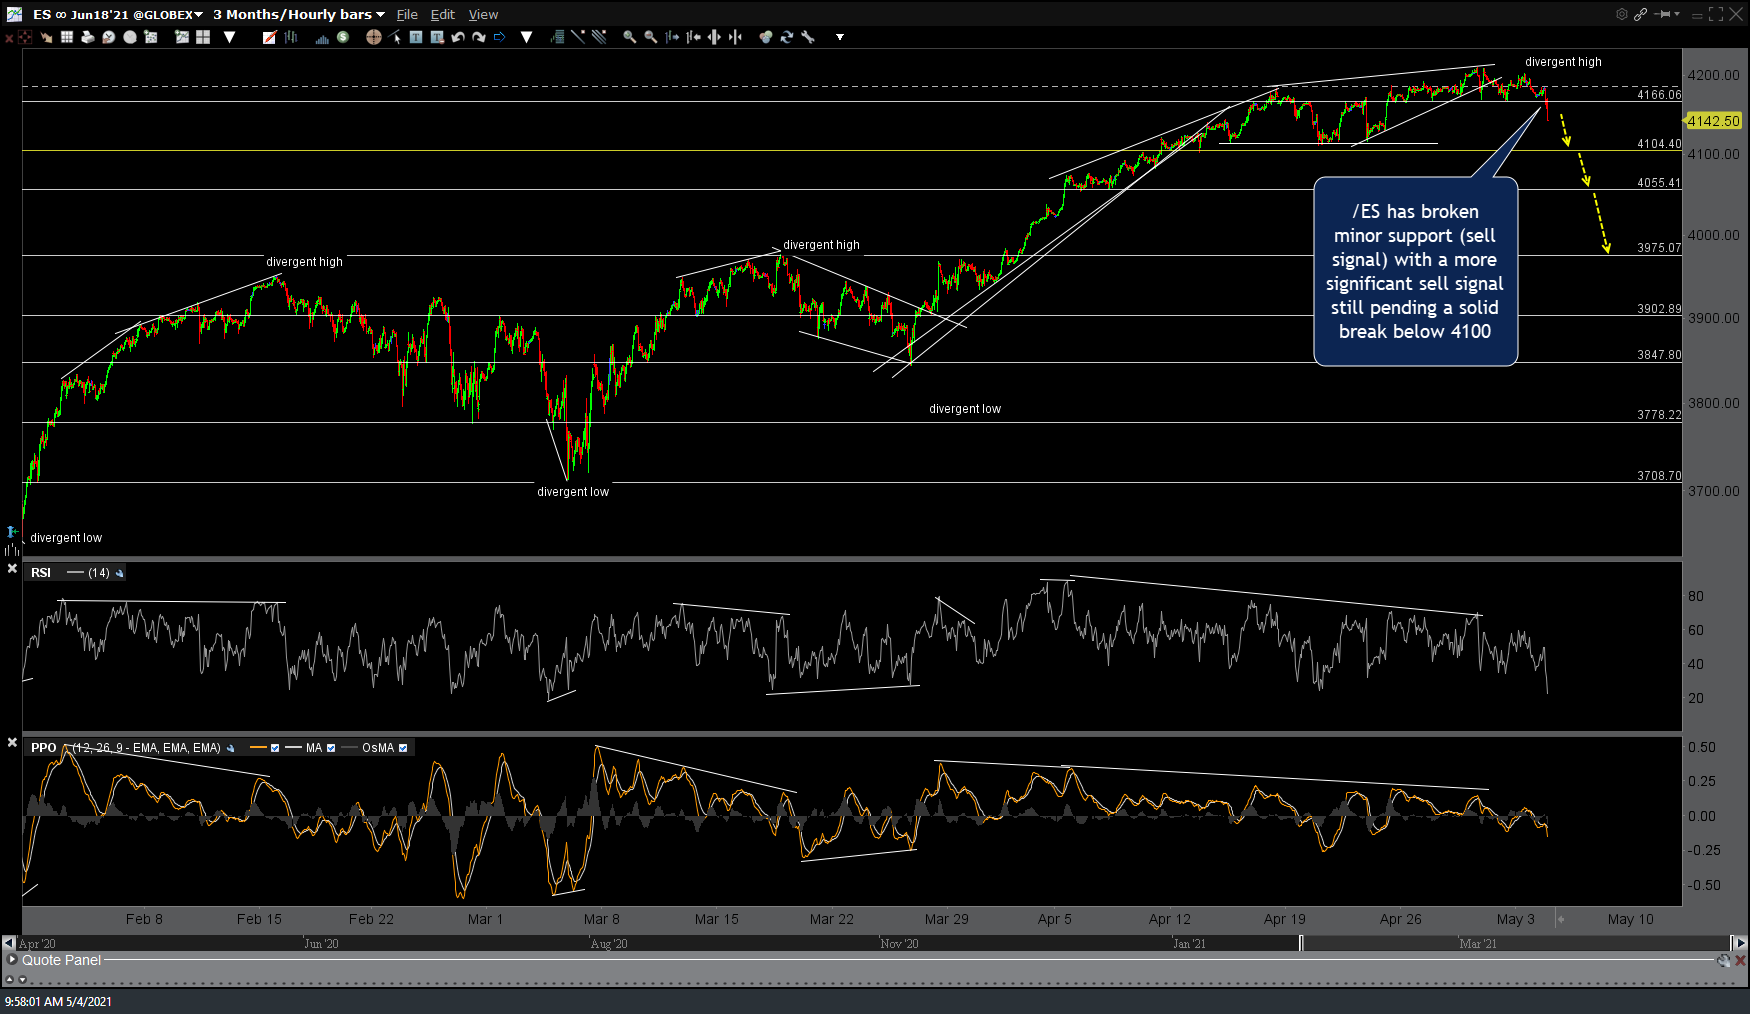
ES 60m May 4th
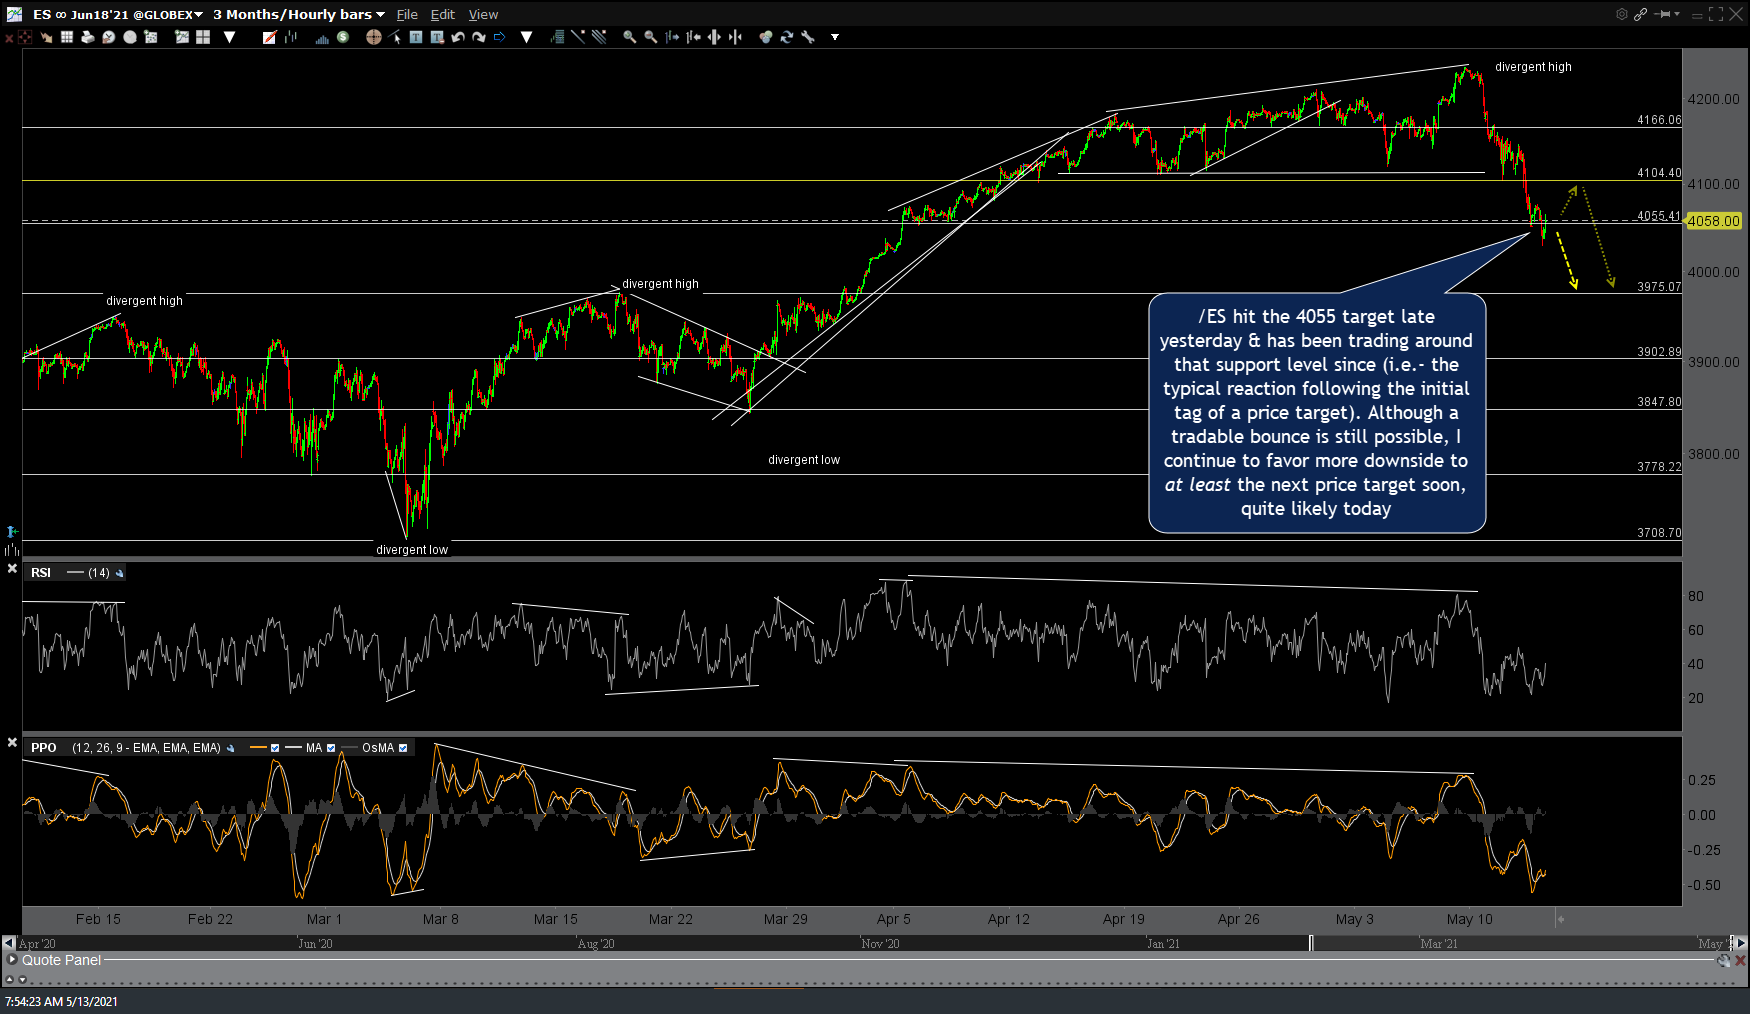
ES 60m May 13th
QQQ closed at & is still trading at the 316ish minor support that was highlighted in yesterday’s video on the 60-minute time frame.

QQQ 60m May 13th
/NQ hit the 12993ish target late yesterday & has been consolidating on that support level since (i.e.- typical reaction following the initial tag of a price target). While a tradable bounce is still possible, I continue to favor more downside to at least the next price target soon. Previous & updated 60-minute charts below.

NQ 60m May 11th
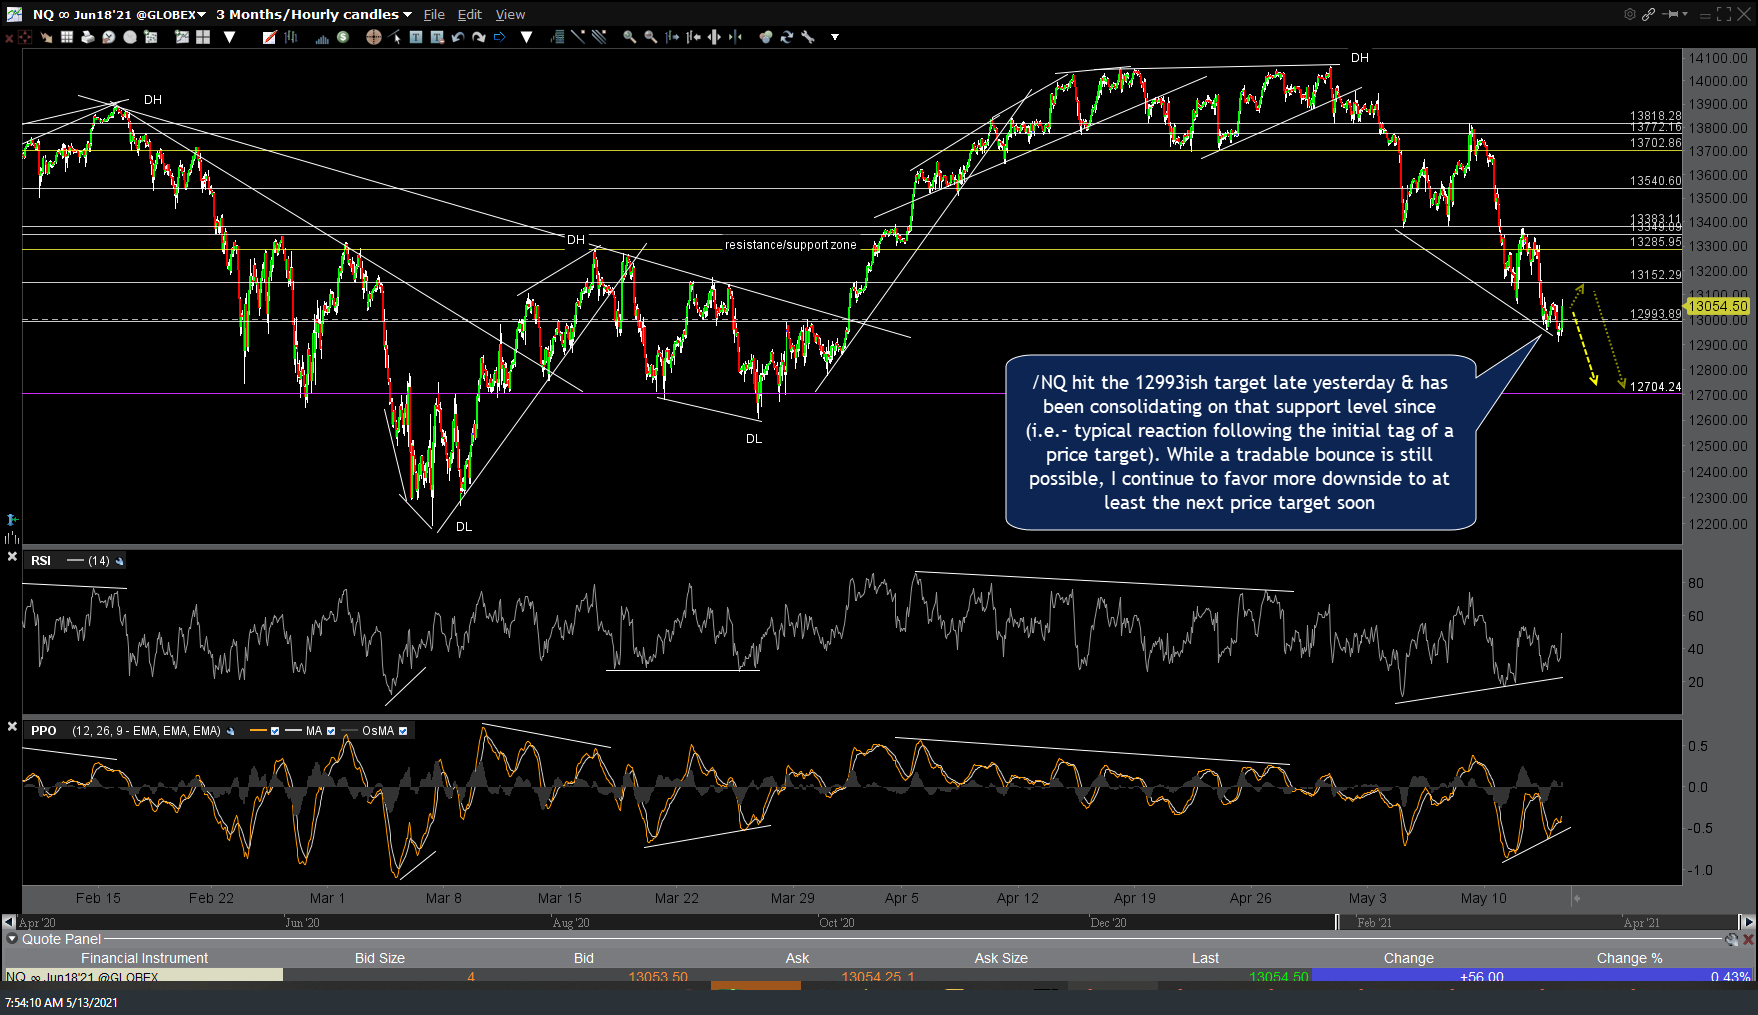
NQ 60m May 13th
Bottom line: We’ve done a good job threading the needle via the 60-minute charts recently. However, where the recent sell signals on the 60-minute time frames helped to get an early jump on short positions (as well as some quick counter-trend ‘bounce-back-to-resistance’ long trades) the recent sell signals on the more significant daily charts have put the markets on the first decent sell signals for swing trade short positions in a while. As such, less active traders (typical swing traders) might want to sit tight on short positions with the appropriate stops in place while holding out for their preferred price target(s), riding out the minor zigs & zags along the way.
Long-side only traders could use bounces back to resistance to lighten up and/or breaks of support as stop-loss levels to mitigate losses. While there aren’t any guarantees that the stock market is headed lower, the odds that it will have increased substantially in the wake of the recent sell signals.
Finally, while we do have some decent sell signals on the 60-minute & daily time frames, the bullish trend off the March 2020 lows has been unusually resilient & as such, I will be monitoring the even more significant weekly charts for any sell signals as the long-term trend clearly remains bullish at this time. All that matters on the weekly time frame is how the candlesticks close at the end of each week (Friday 4pm). Should some of the intermediate & longer-term trend indicators start to roll over soon, my downside targets would be extended. Likewise, should we get some bullish developments soon (divergences, rallies off support that start to take out overhead resistance levels that “should” cap any snapback rallies, etc…) then the correction will likely be limited to the initial price targets, potentially even those that have just been hit although that is not my preferred scenario at this time (i.e.- more downside is still likely in the coming days to weeks).