
SPY broke down below the minor uptrend line yesterday following the recent bearish PPO crossover & extreme overbought RSI reading. IMO, the best case scenario is one more thrust up to put in a marginal new & divergent high followed by a trend reversal while the the more bearish scenario is the rally ended on Feb 2nd with the next tradable leg down already underway. I’d give about equal odds to both at this time & will continue to convey my thoughts, as the charts develop going forward. Daily chart below.
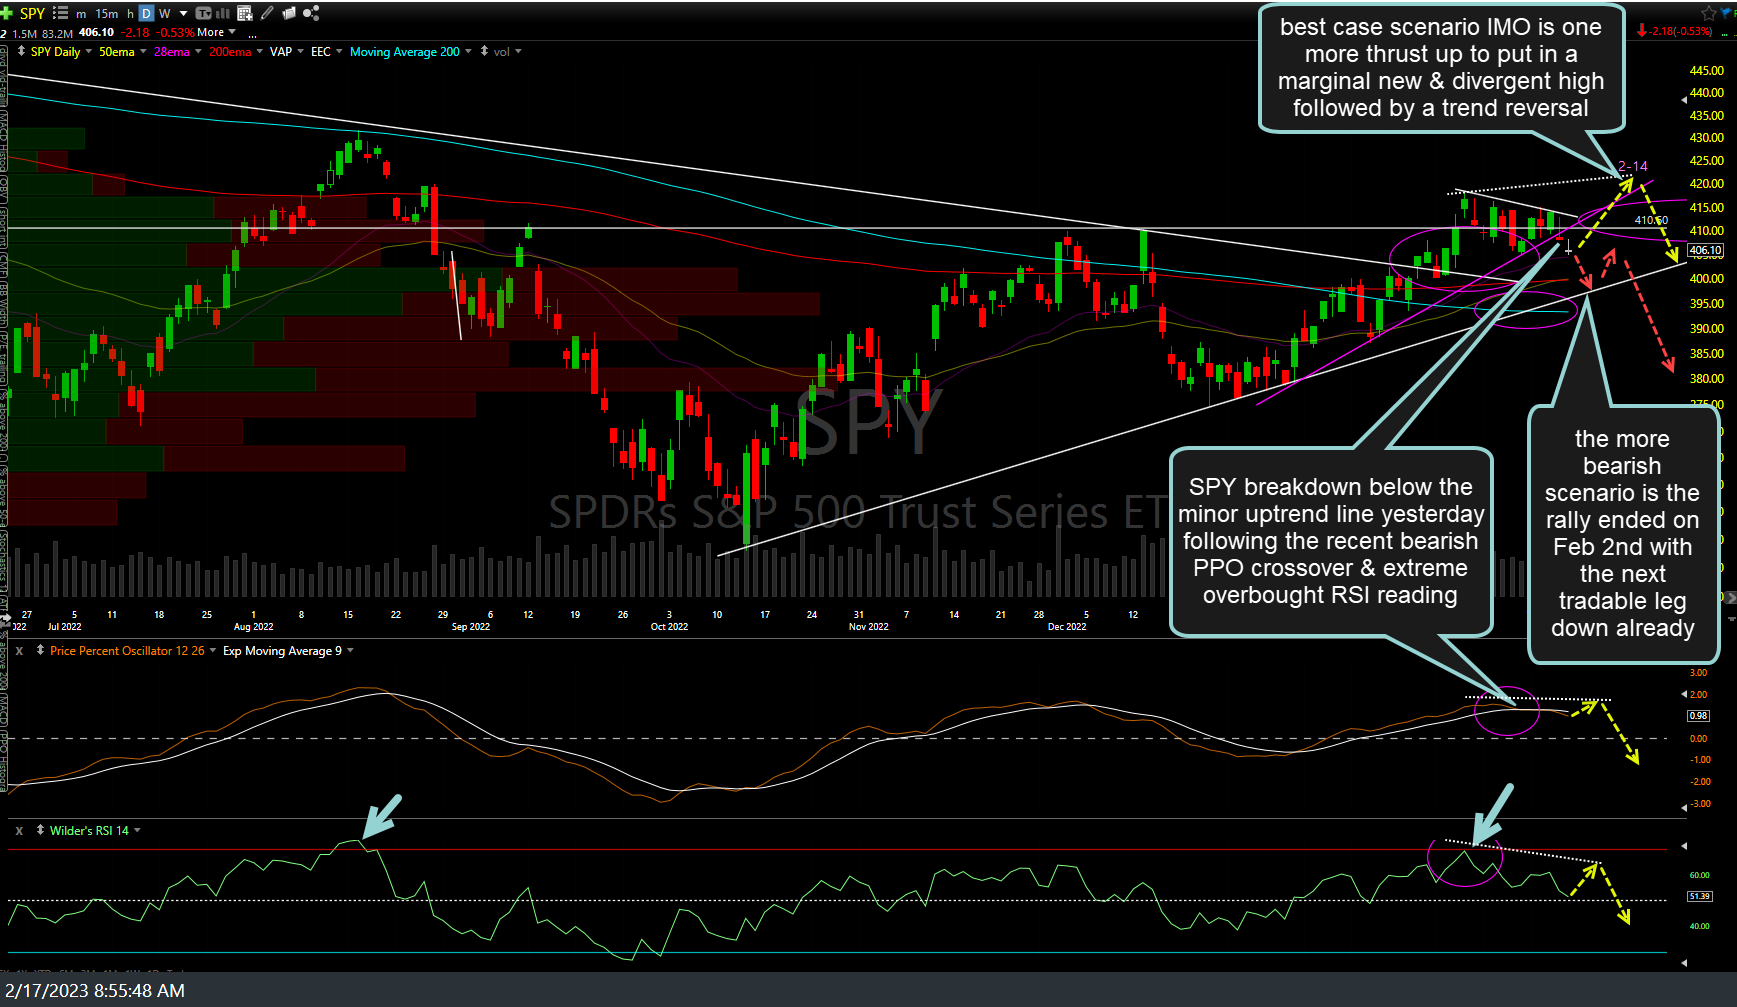
SPY daily Feb 17th
While I didn’t draw both scenarios on the QQQ daily chart below, my current outlook is the same with roughly equal odds that, at best, we get one more thrust up to put in a marginal new & (most likely) divergent high which will mark the end of the rally off the January lows …or.. the rally already ended on Feb 2nd with more downside in the coming days to weeks+. By ‘maginal’ new high, I am referring to a thrust not much more than 3% above the Feb 2nd high. Also worth noting is the fact that QQQ finalized a bearish crossover on the daily time frame at yesterday’s close, following the recent PPO bearish crossovers on SPY, MDY, & IWM. See daily chart below for additional comments & highlights.

QQQ daily Feb 17th
The 60-minute chart of QQQ below highlights the breakdown below the minor trendline/price channel yesterday following the recent break below the primary uptrend line in QQQ.
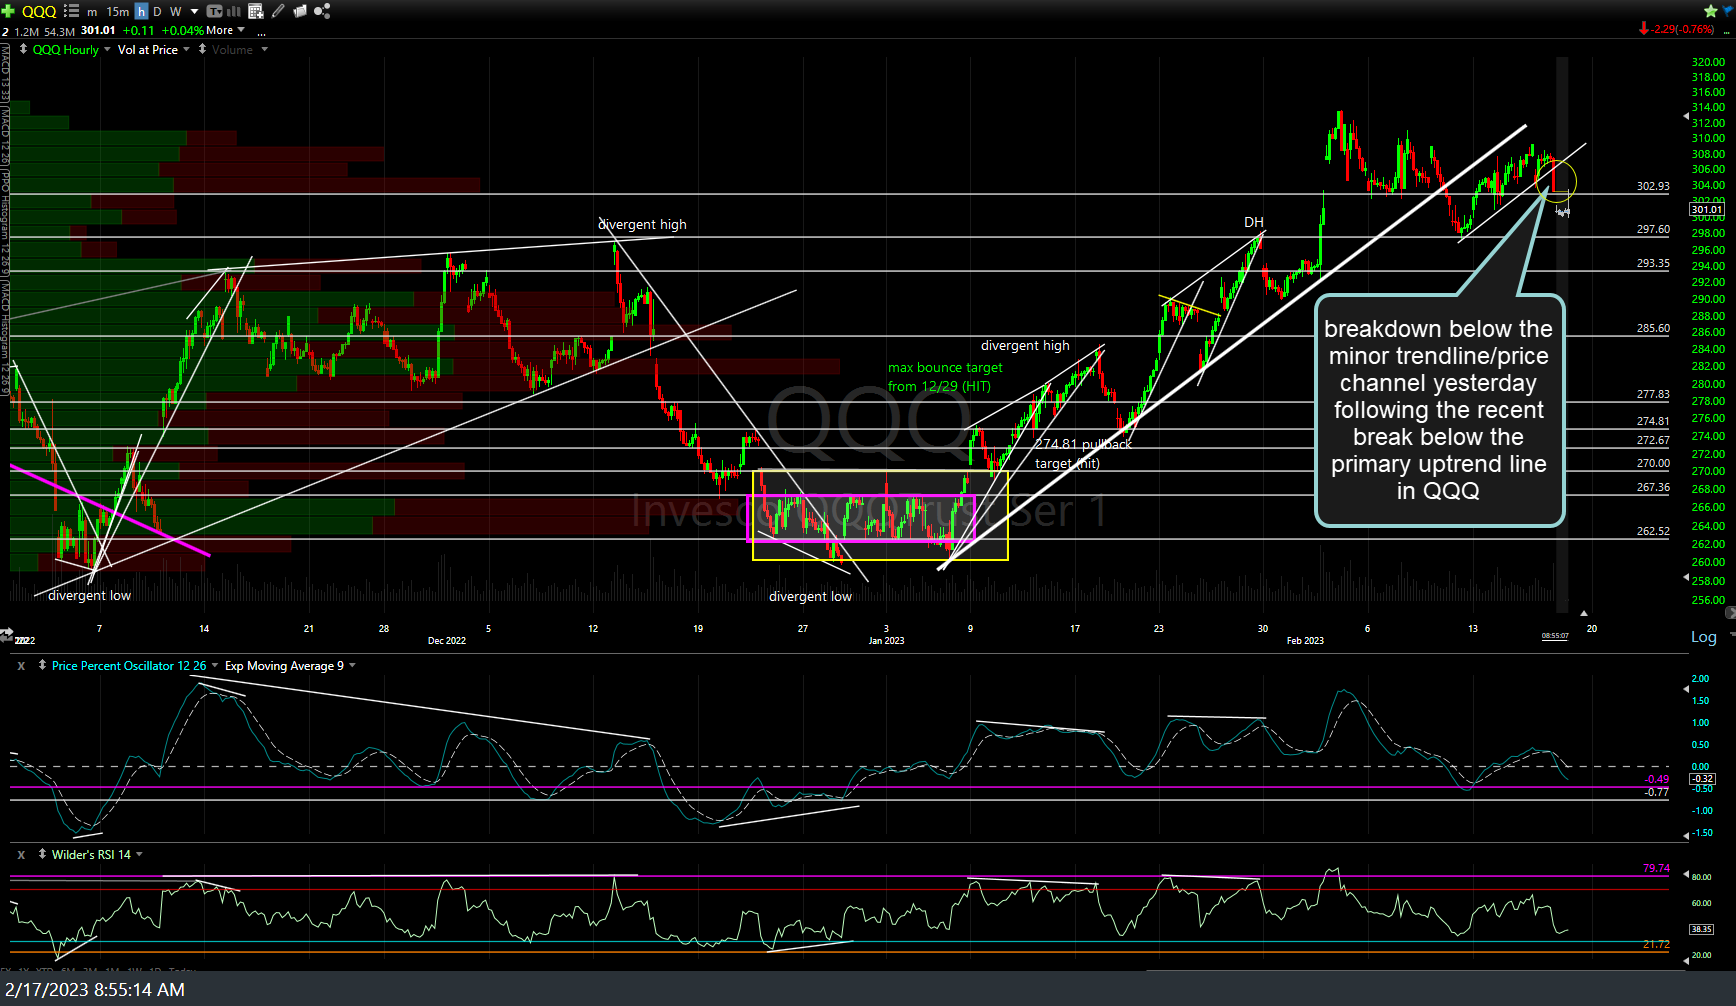
QQQ 60m Feb 17th
/ES sell signal triggered on minor uptrend line break with any rally to backtest the 4100 resistance, minor uptrend line from below, and/or the minor downtrend line off the highs to offer objective short entries or add-ons, as would be a break below the 4060ish support that /ES is current trading on. 60-minute chart below.
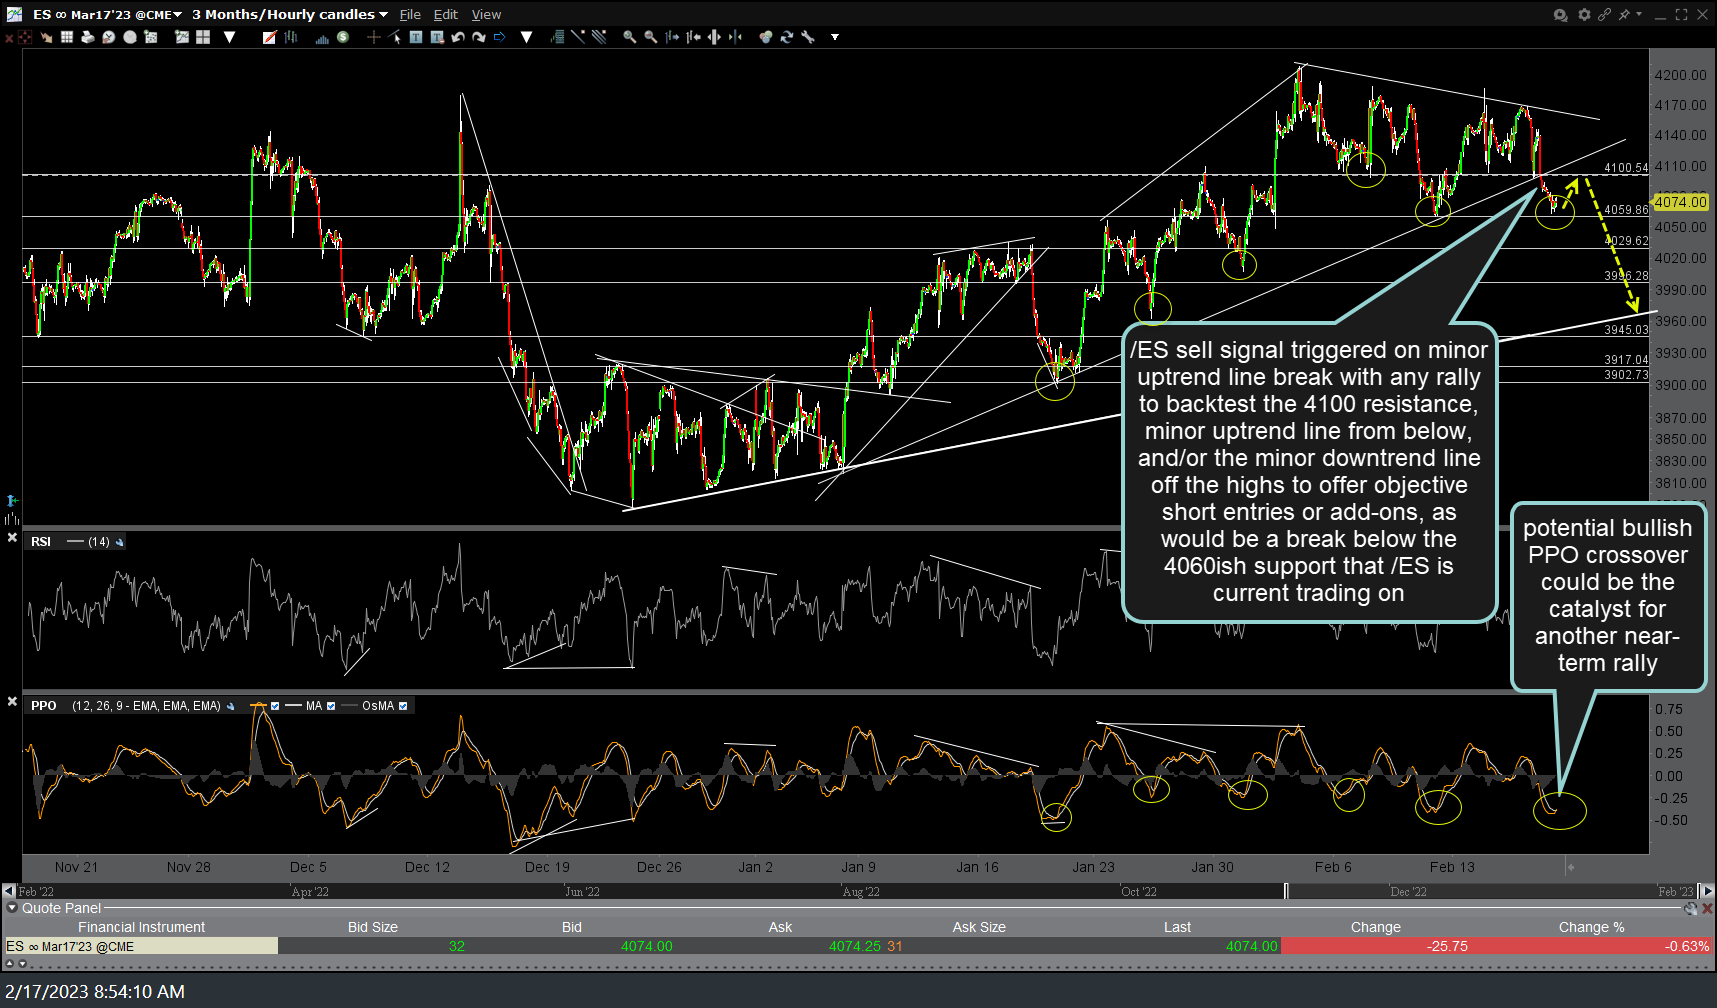
ES 60m Feb 17th
/NQ triggered a sell signal on the impulsive breakdown below the previously highlighted minor uptrend line which formed the small price channel just below the primary, more significant uptrend line that was recently broken & backtested from below. A couple of things that keep me from getting more aggressively short, at this time, are the rarely seen ‘extreme’ 22.60ish oversold reading on the RSI that typical ends pullbacks during bullish trends… although this could be the start of a new bearish trend & in which oversold tends to become ‘more oversold’ …coupled with…a potential bullish PPO crossover could be the catalyst for another near-term rally..or the PPO gets rejected here (i.e.- no crossover or only a brief whipsaw cross). 60-minute chart below.
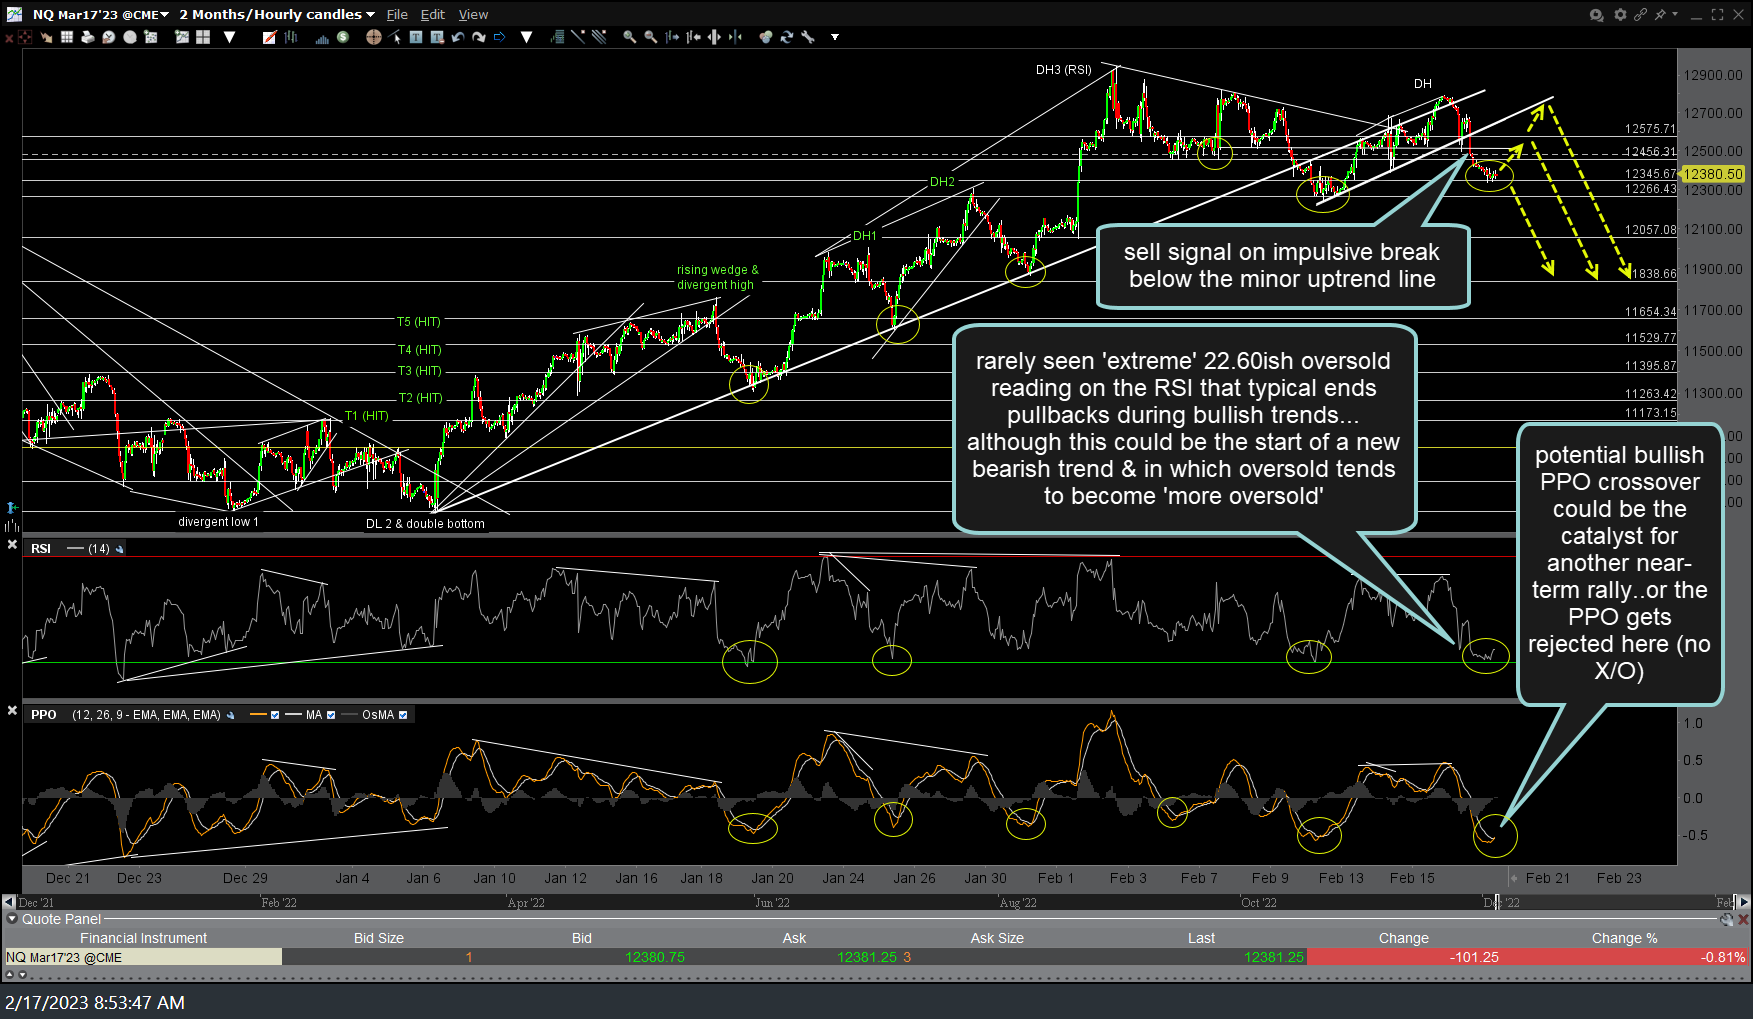
NQ 60m Feb 17th