
/ES (S&P 500 futures) is currently trading at the top of the 60-minute bullish falling wedge pattern & back-testing the mid-Dec uptrend line from below (dual resistance levels) with at least a minor pullback here likely while a solid break & 60-minute close above (& the /NQ falling wedge as well) would be bullish. 60-minute chart below.
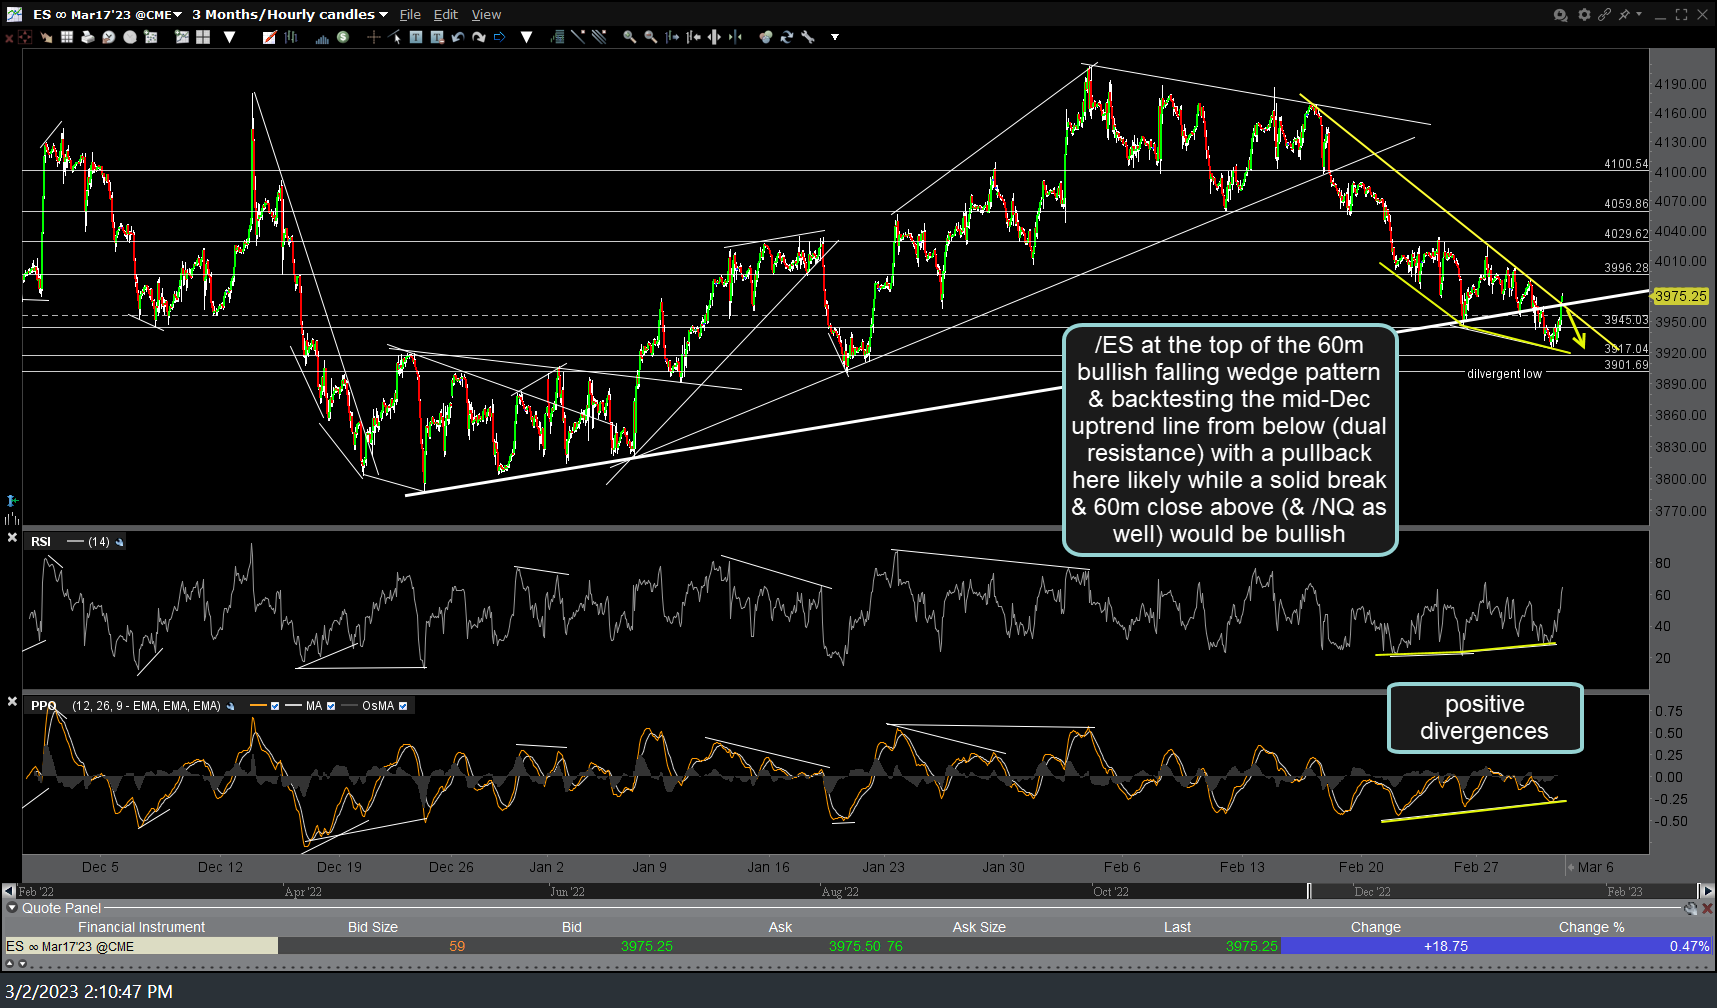
ES 60m March 2nd
/NQ (Nasdaq 100 futures) has also rallied into comparable downtrend trendline resistance (i.e. the top of a bullish falling wedge pattern) with a solid breakout & 60-minute close above the wedge bullish, although at least a minor pullback first seems likely. 60-minute chart below.
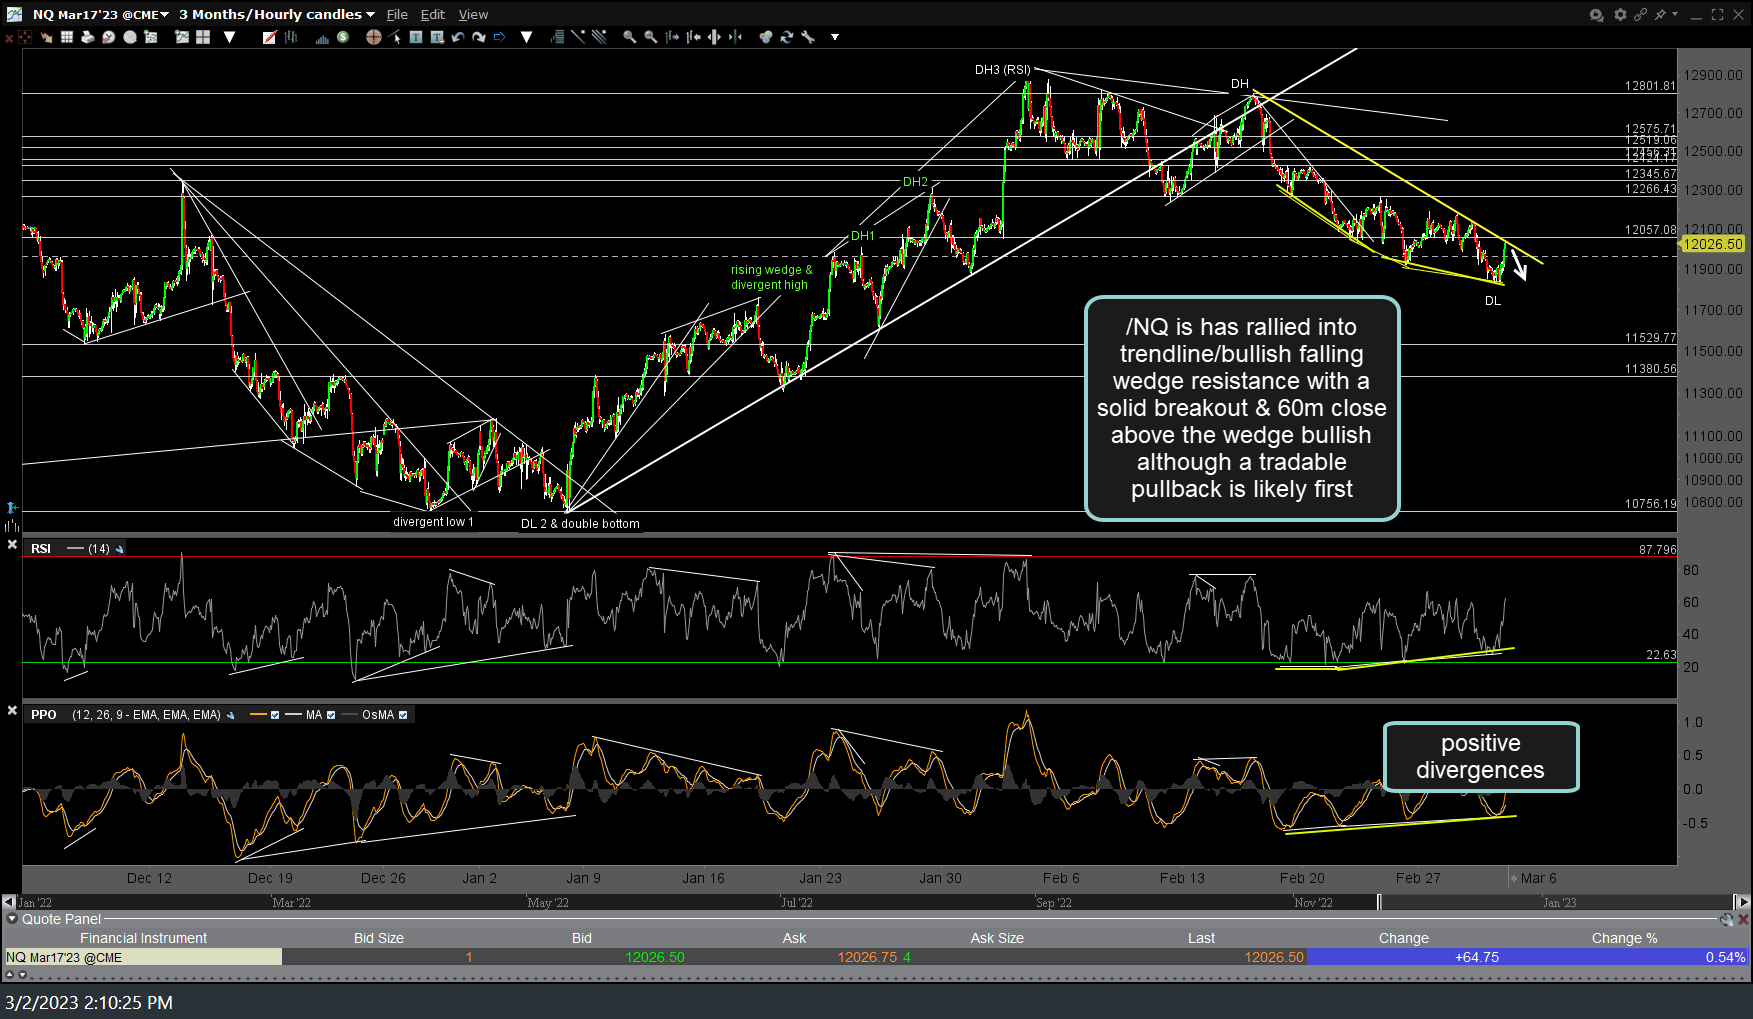
NQ 60m March 2nd
Keep in mind these are intraday charts which are useful for navigating & trading the short-term trends while the both the Nasdaq 100 as well as the S&P 500 remain just above key support on the daily chart (200-day SMA on both with SPY also back-testing the primary bear market downtrend line from above.
As such, a case can still be made for typical swing & even longer-term trend trader to go long here at key support on the daily charts although it would only be prudent to wait for a solid break above these 60-minute wedges, as the indexes are at resistance on that shorter time frame. Likewise, longer-term traders could also wait for a solid breakdown below the aforementioned support levels on the daily charts to initiate or add to any short positions.
As I’m finishing composing this post, I can see that we already had a minor reaction (pullback) off the tops of those 60-minute falling wedges with the indices making another run up which now increases the chance of a breakout soon.