
We now have downside breaks below the recent lows on the Nasdaq 100 as well as the S&P, albeit only by a very slight margin on the S&P 500 (as I type). However, these are sell signals until/unless the bulls can ramp /NQ & /ES back above the recent lows & keep these divergences intact while the bears need to follow through on the breakdown, takeout the divergences & run. If so, things could get ugly (or beautiful, if short) soon. 10-minute charts below.
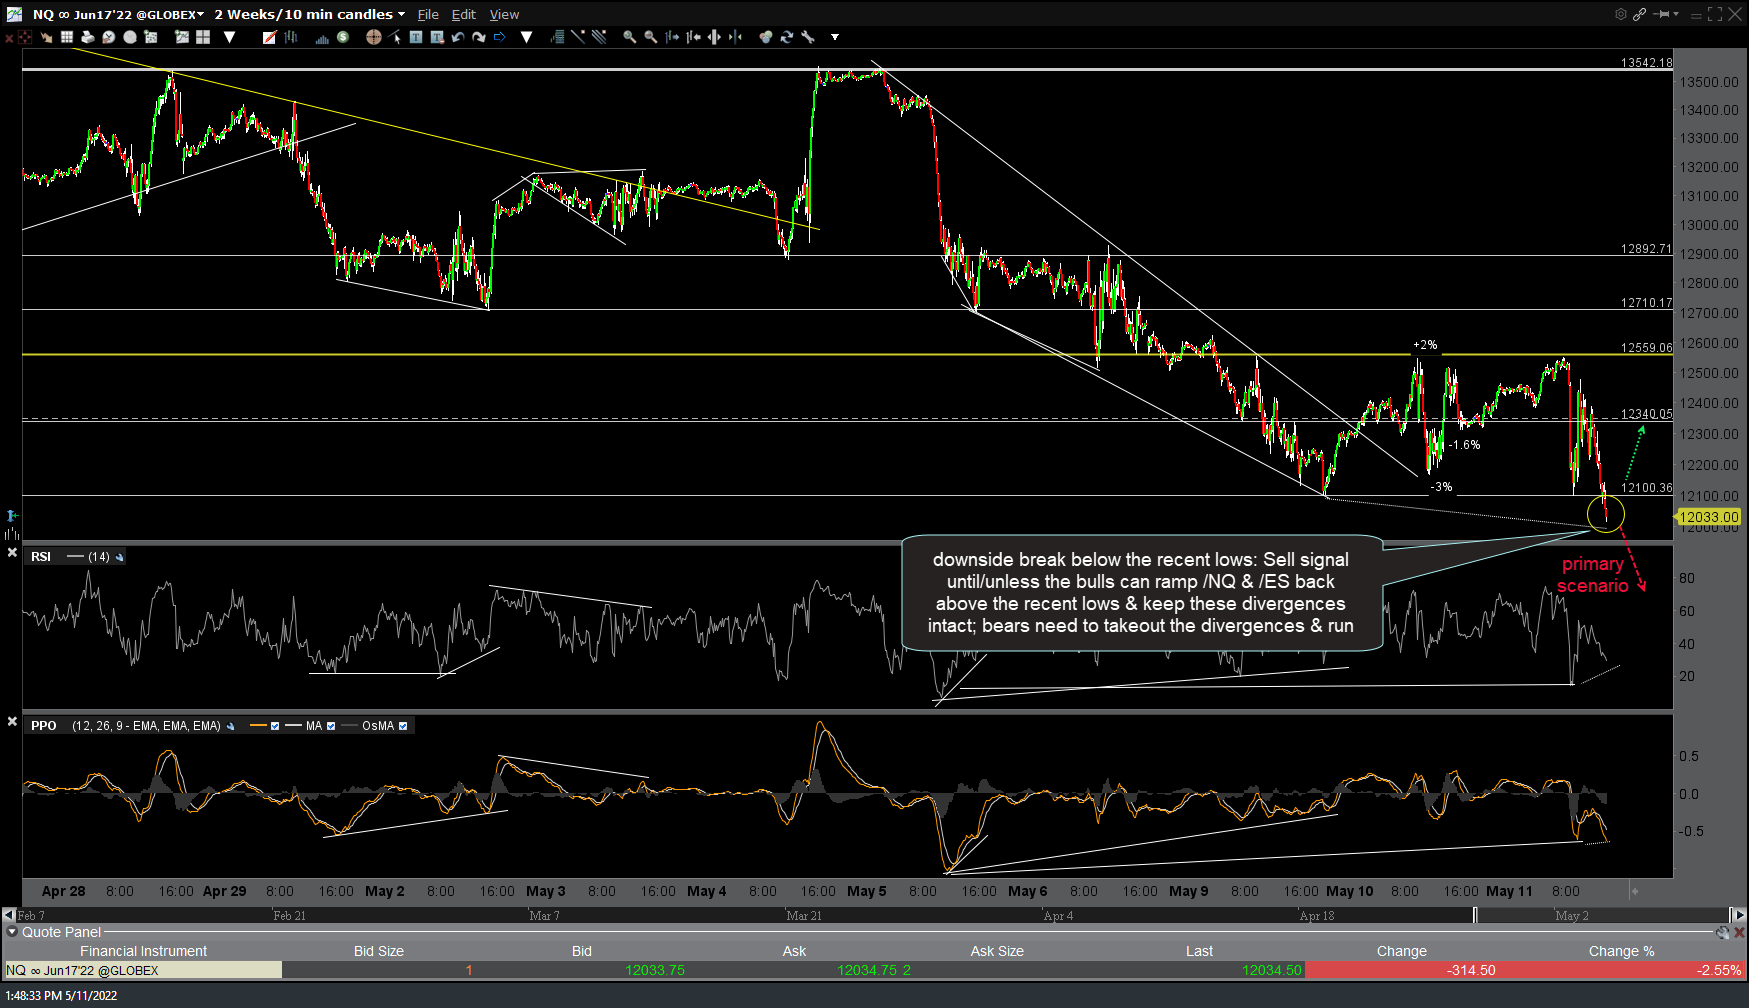
NQ 10m 2 March 11th
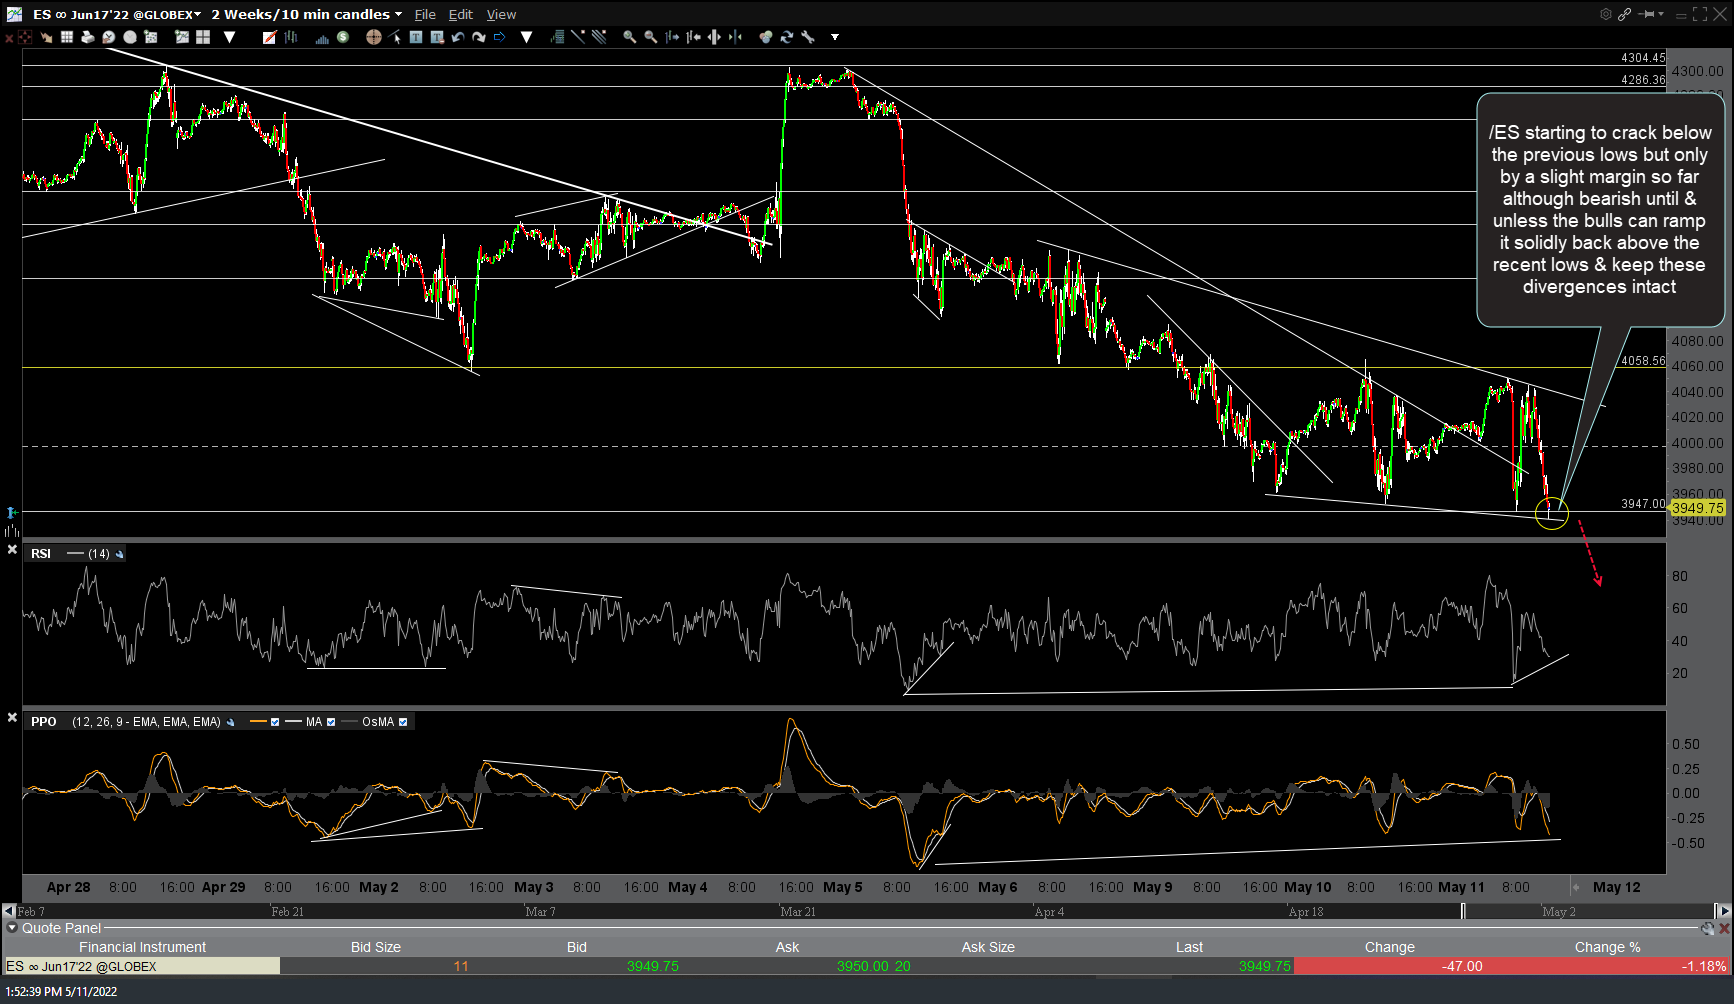
ES 10m 2 May 11th
On a closely related note, AAPL (Apple) has also taken out its recent lows, which provides another checkmark to the bearish case until & unless AAPL can solidly snap back above those recent lows. The company did recently authorize a whopping $90B stock buyback plan & I’m not sure if they have the ability to fire off purchases at will (tactically, as in right now to trigger a bear trap/false breakdown) or if the buybacks must be at pre-set intervals. Regardless, the important thing will be to see if there are more sellers than buyers, be they natural buyers (i.e.- retail as well as institutional investors & traders) or unnatural buyers (corporate buy-backs, PPT, indirectly buying AAPL via stock futures, etc..). As of now, just one more in a growing number of checkmarks for the longer-term bearish case.