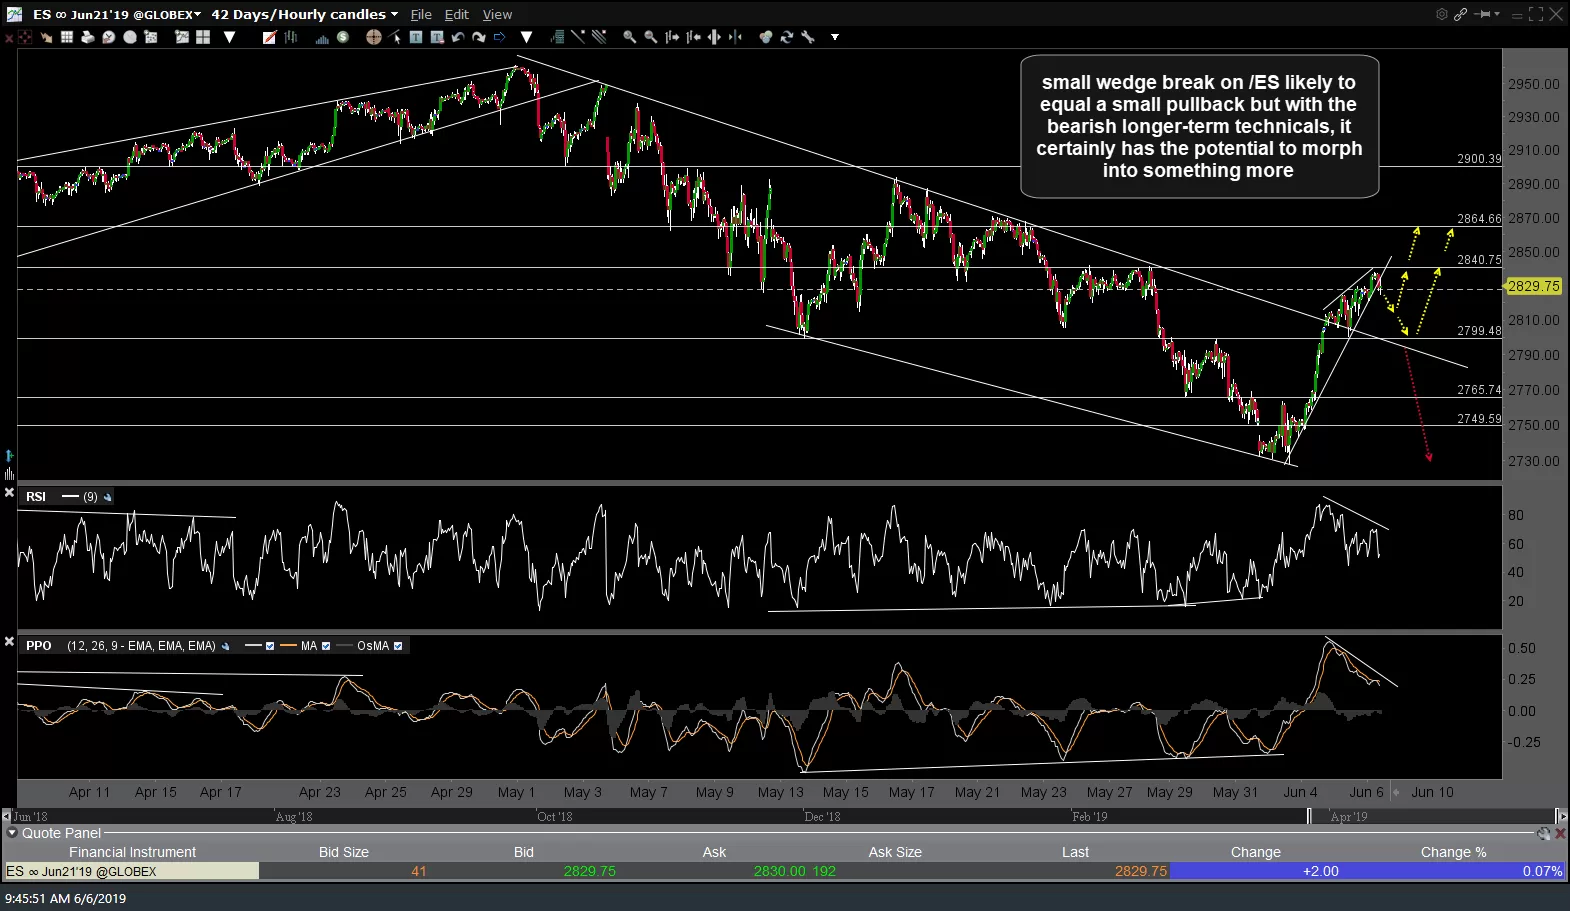
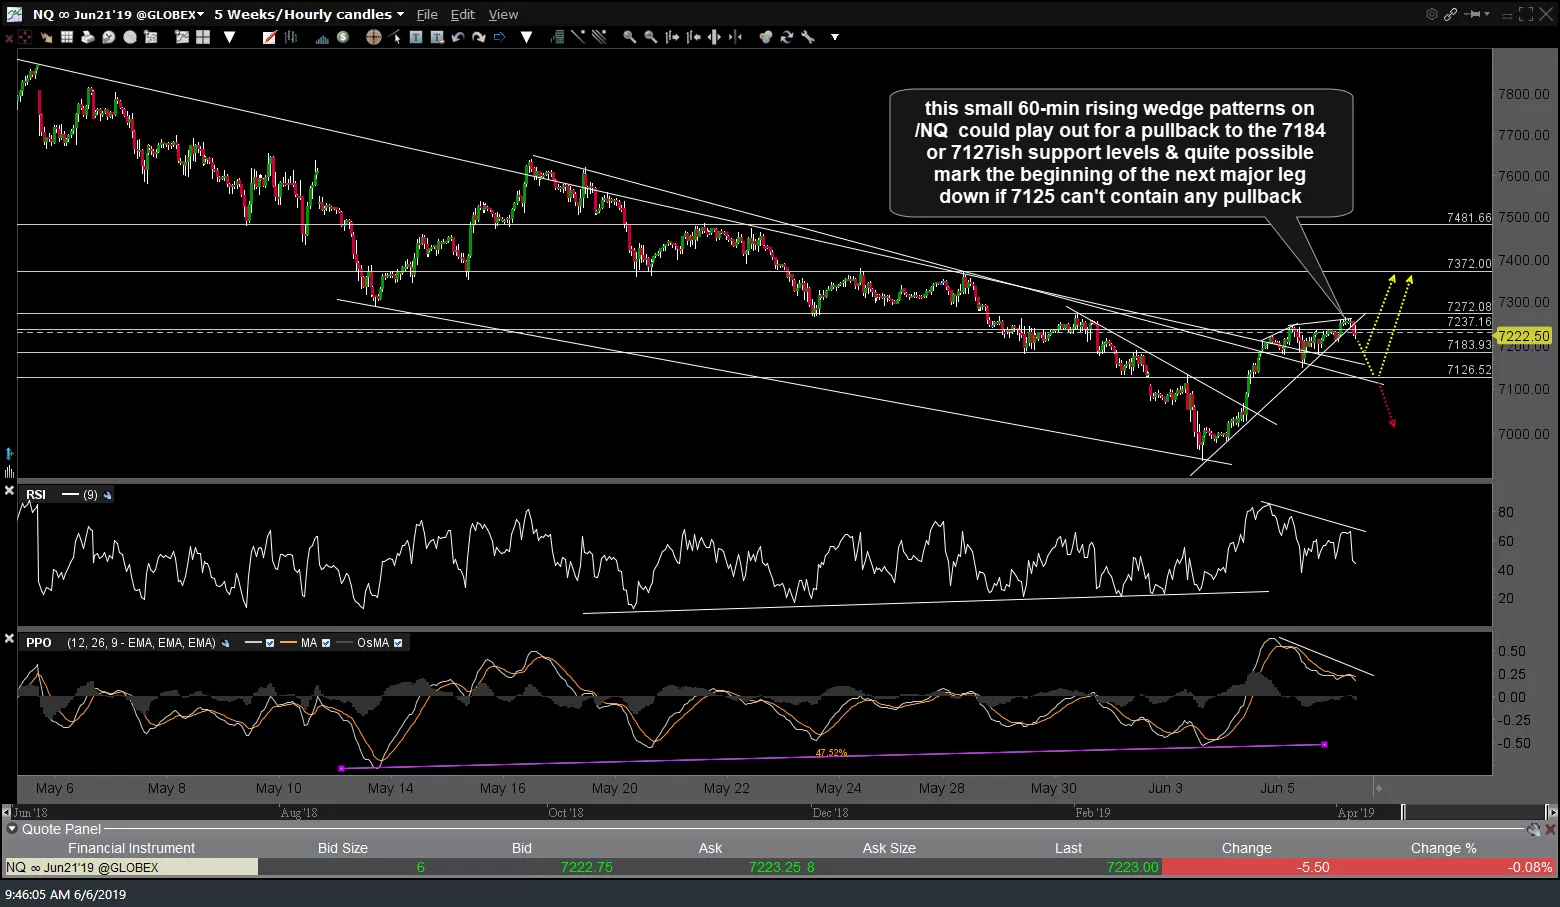
These small wedge pattern breakdowns on /ES (S&P 500) and /NQ (Nasdaq 100) are likely to equal a small pullback followed by a resumption of the near-term uptrend but with the bearish longer-term technicals, it certainly has the potential to morph into something more. Support levels that “should” contain any pullbacks are shown on these 60-minute charts below.
-
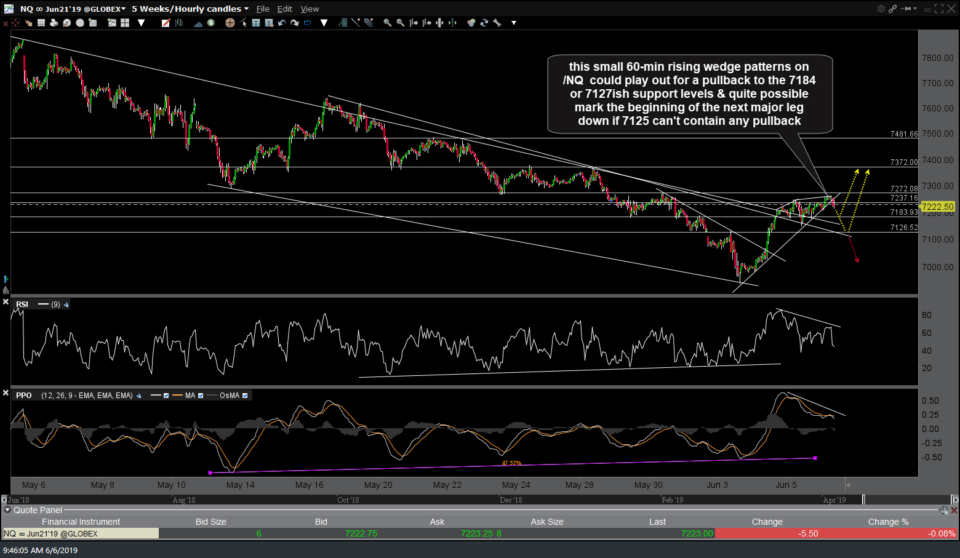
- NQ 60-min June 6th
-

- ES 60-min June 6th