
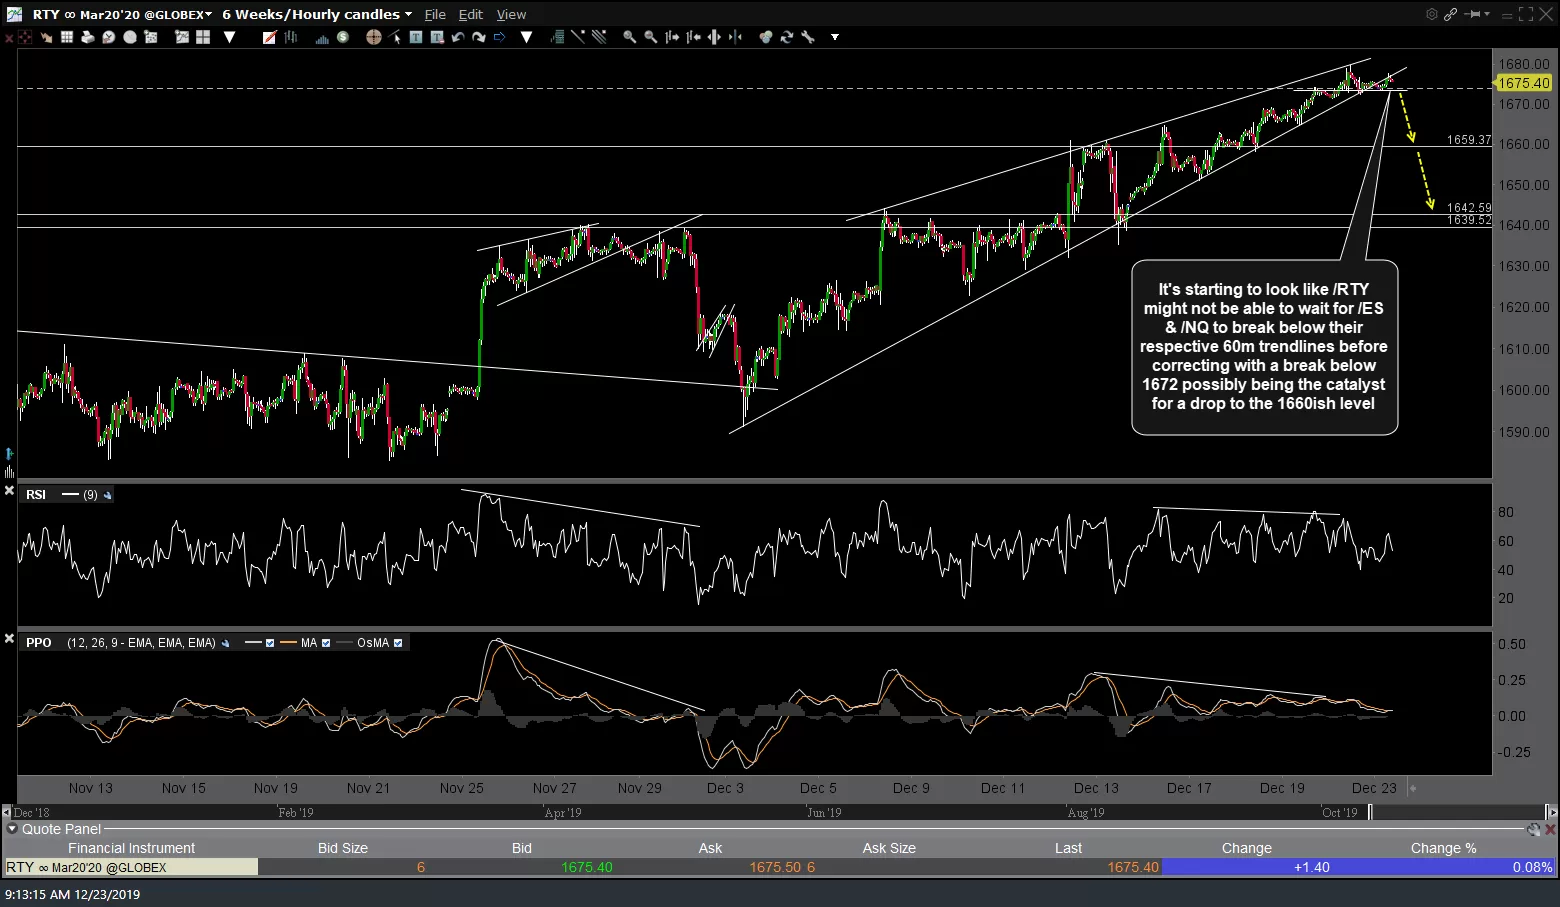
It’s starting to look like /RTY (Russell 2000 Small-Cap futures) might not be able to wait for /ES & /NQ to break below their respective 60m trendlines before correcting with a break below 1672 possibly being the catalyst for a drop to the 1660ish level. 60-minute charts below.
-

- RTY 60m Dec 23rd
-
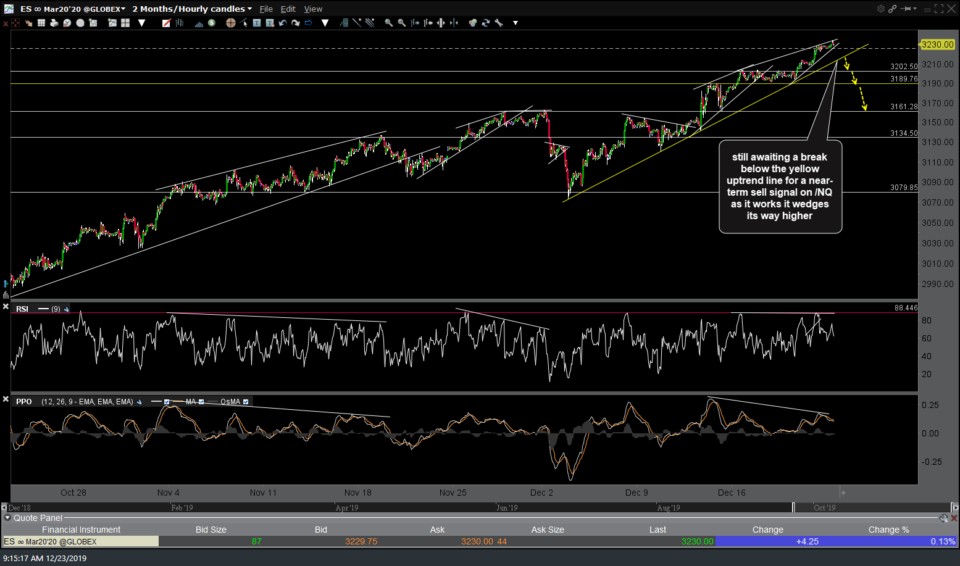
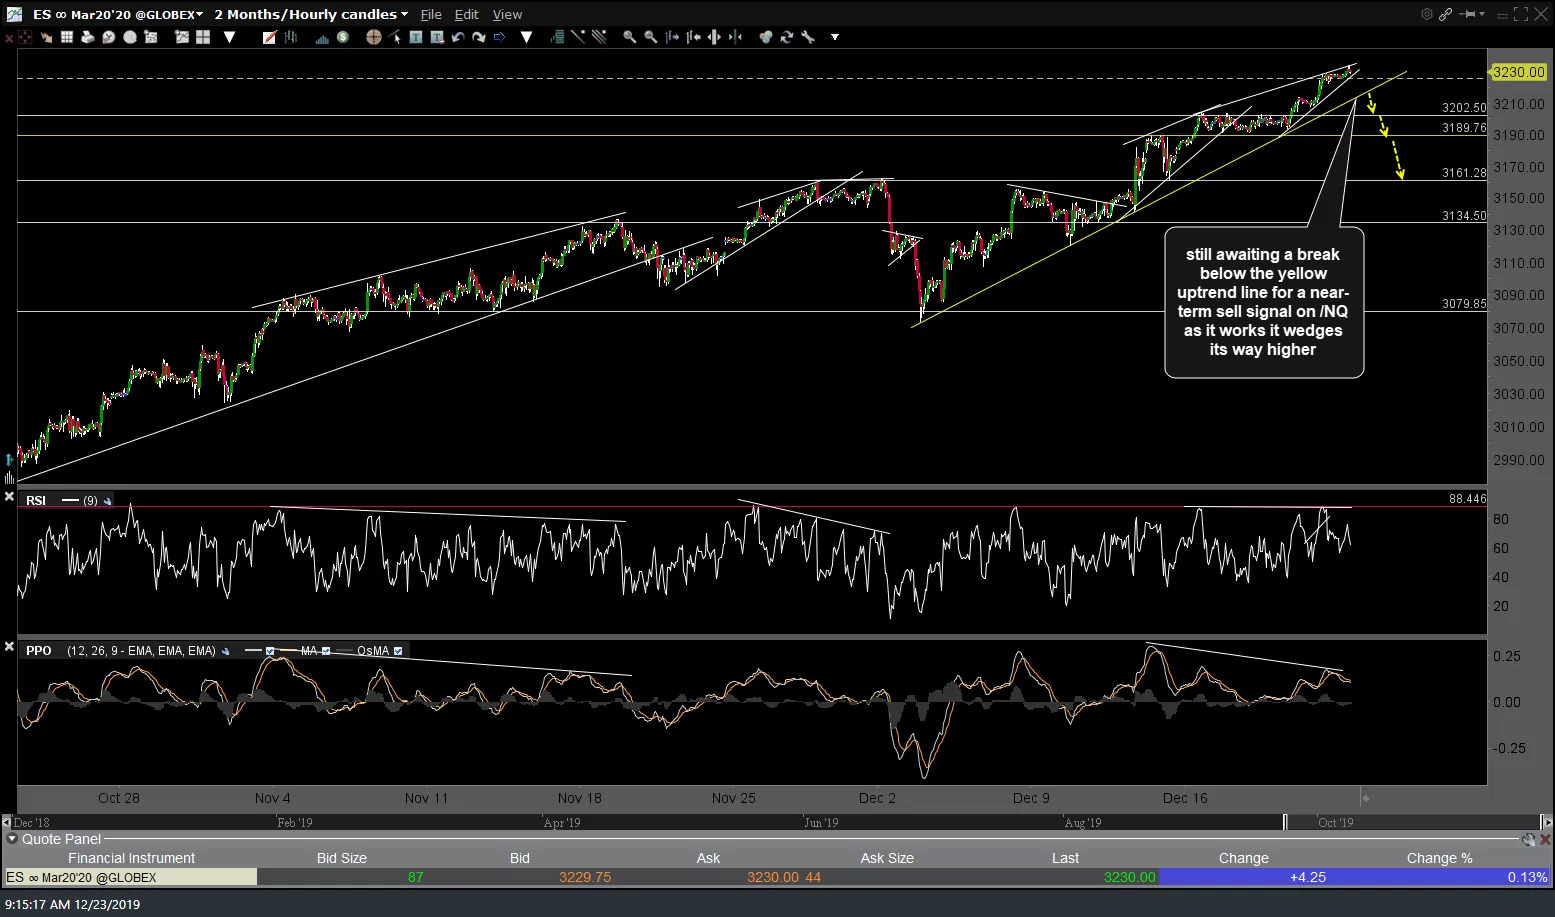
- ES 60m Dec 23rd
-
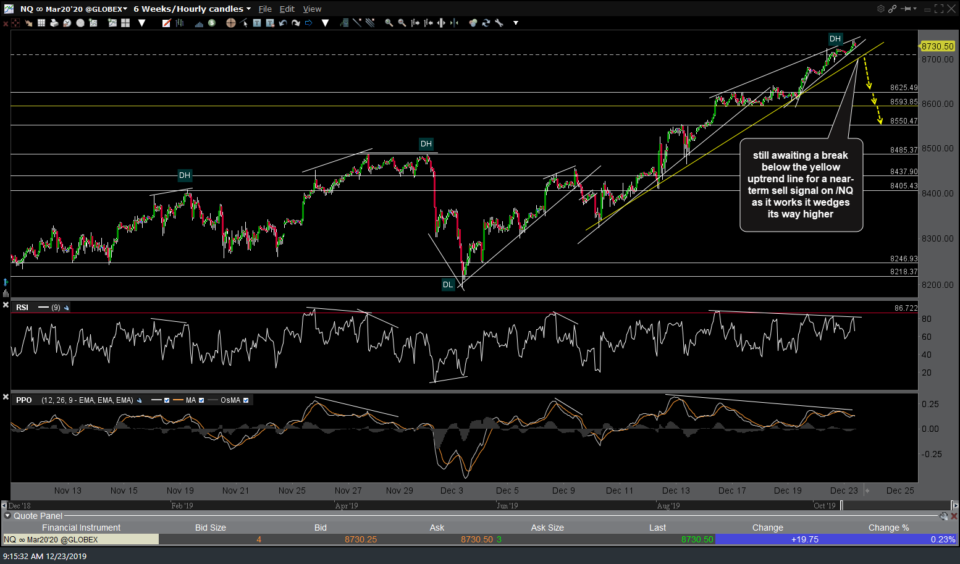
- NQ 60m Dec 23rd
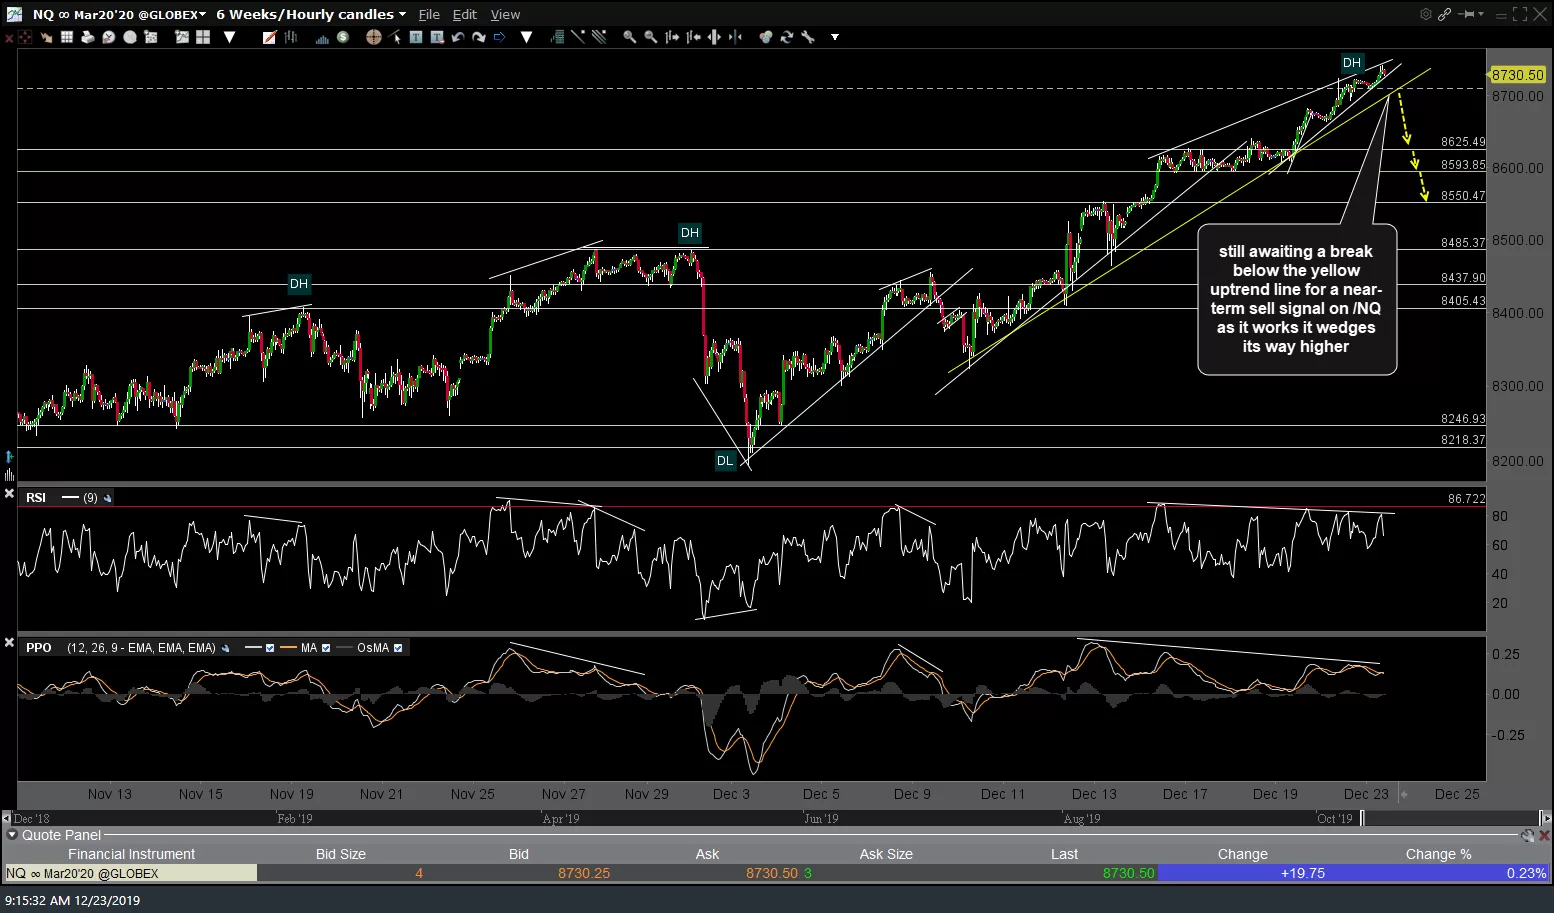
The trend remains clearly bullish for now without any sell signals (other than a slight but non-impulsive dip below the uptrend line/wedge on /RTY). Also, keep in mind that this week not only tends to favor the bulls but is also plagued with whipsaw signals due to the low-volume & abbreviated holiday trading week. On the flip-side, the charts are the charts & these are some pretty clean bearish rising wedge patterns confirmed with negative divergences between price & the momentum indicators so trade them (or pass) as you see fit. I will follow up with updated charts of SPY, QQQ & IWM in a new post or in the comment section below this post soon although I’d like to see what happens after the first hour or so of trading today.