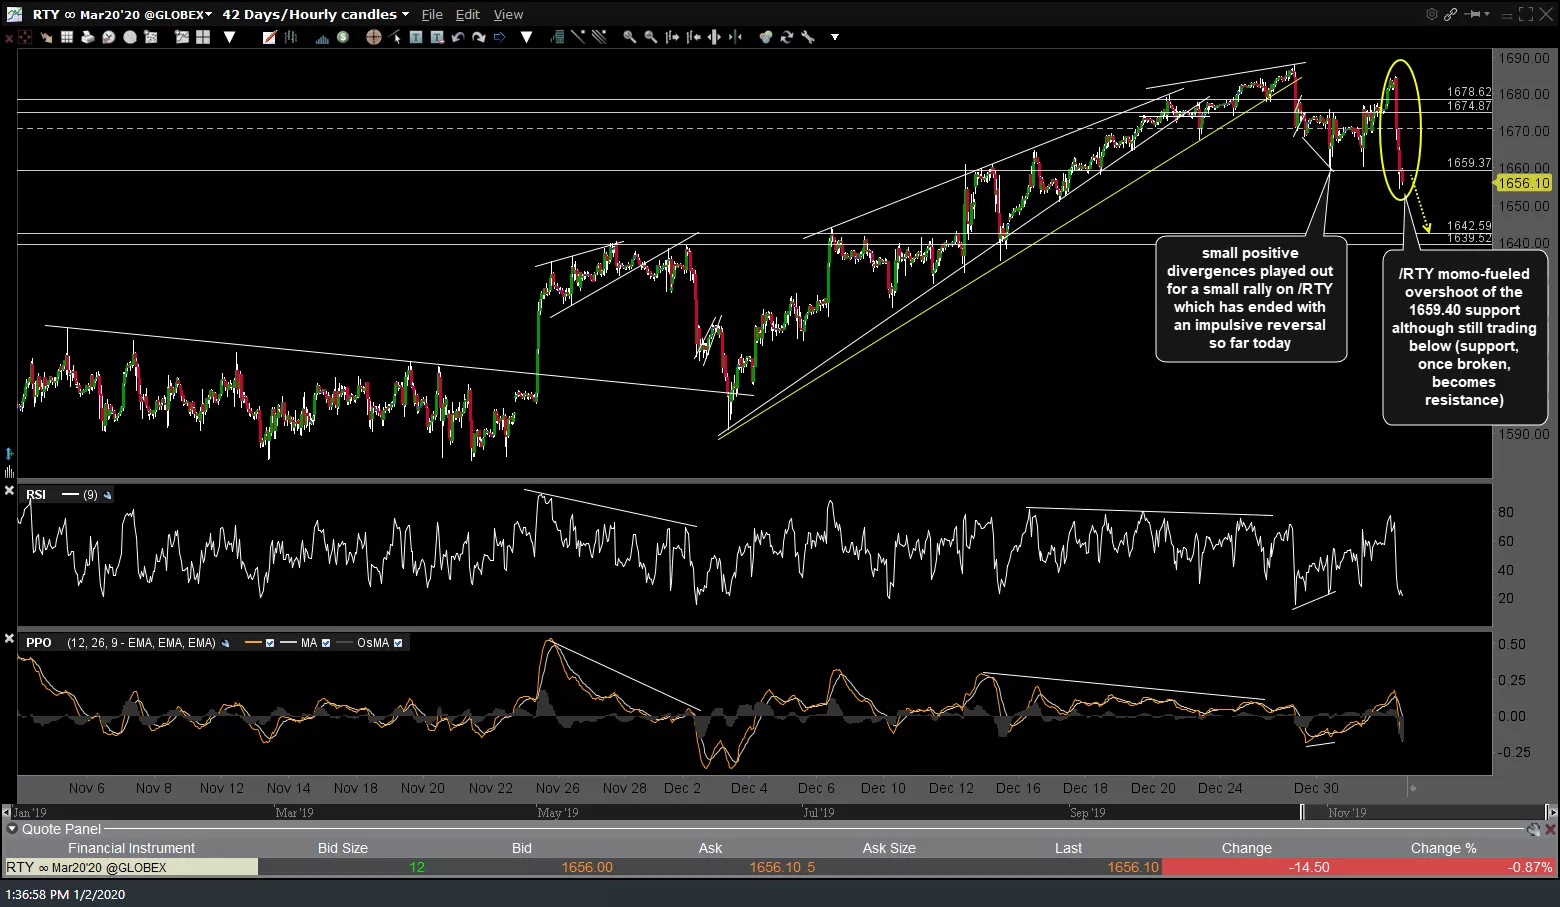
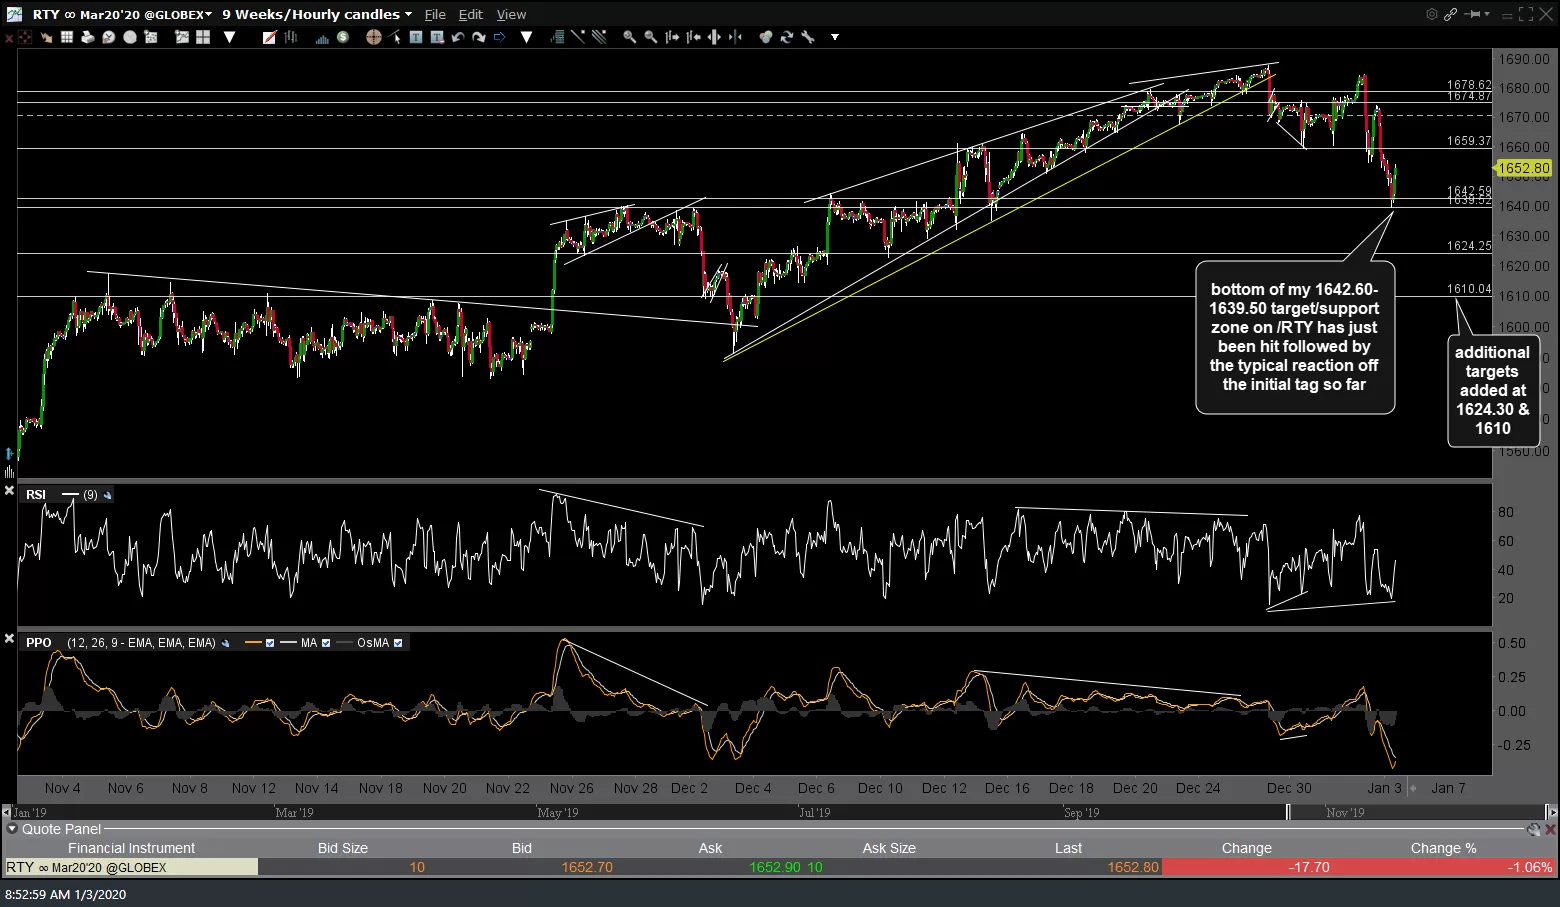
The bottom of my 1642.60-1639.50 target/support zone on /RTY (Russell 2000 futures) has just been hit followed by the typical reaction off the initial tag so far. With the recent trend so resilient, it’s hard to say whether or not we’ll get another thrust down although I’d give it somewhat better than 50/50 odds. If so, any more upside from here will likely be capped by the 1659.40ish resistance level. I’ve also added two more potential pullback targets at 1624.30 & 1610 for those currently short or looking to position long on pullbacks to support. Previous & updated 60-minute charts below.
-
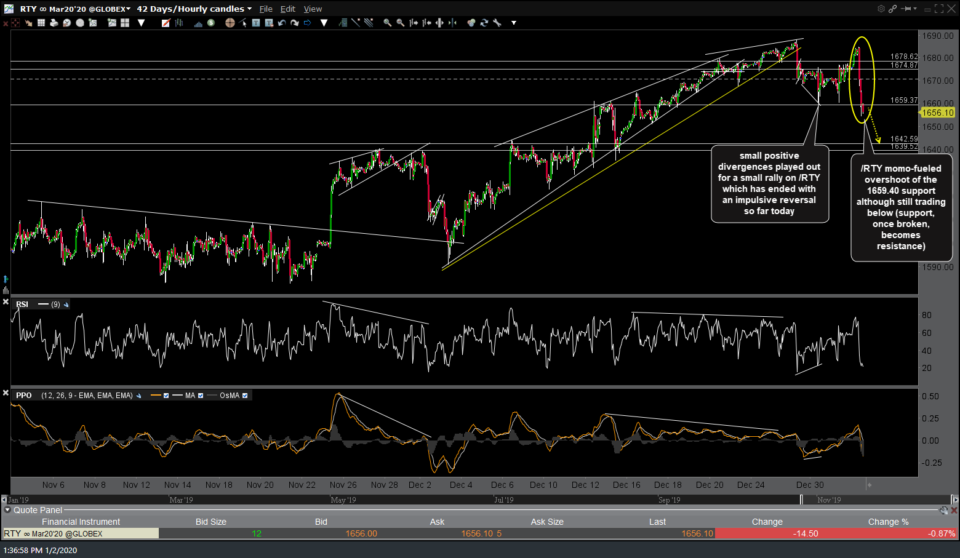
- RTY 60m Jan 2nd
-
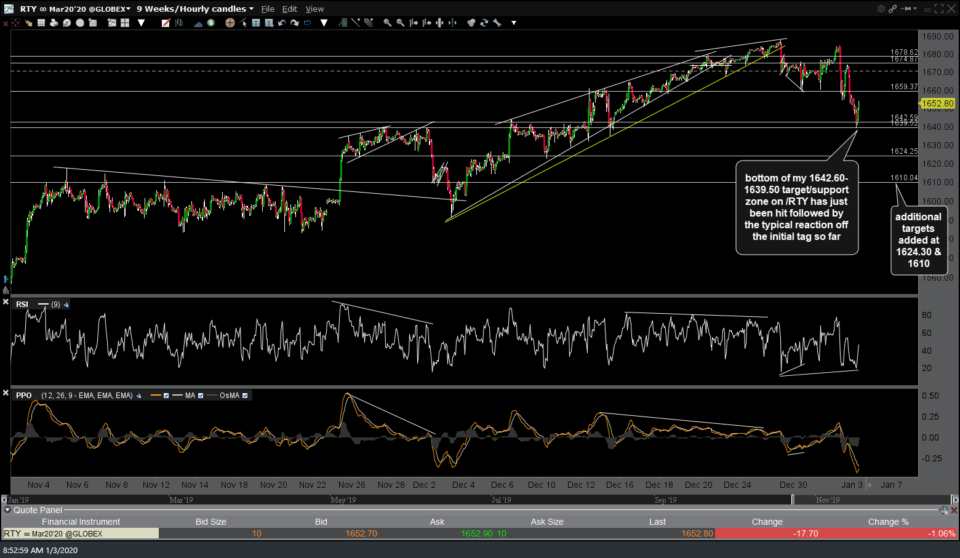
- RTY 60m Jan 3rd
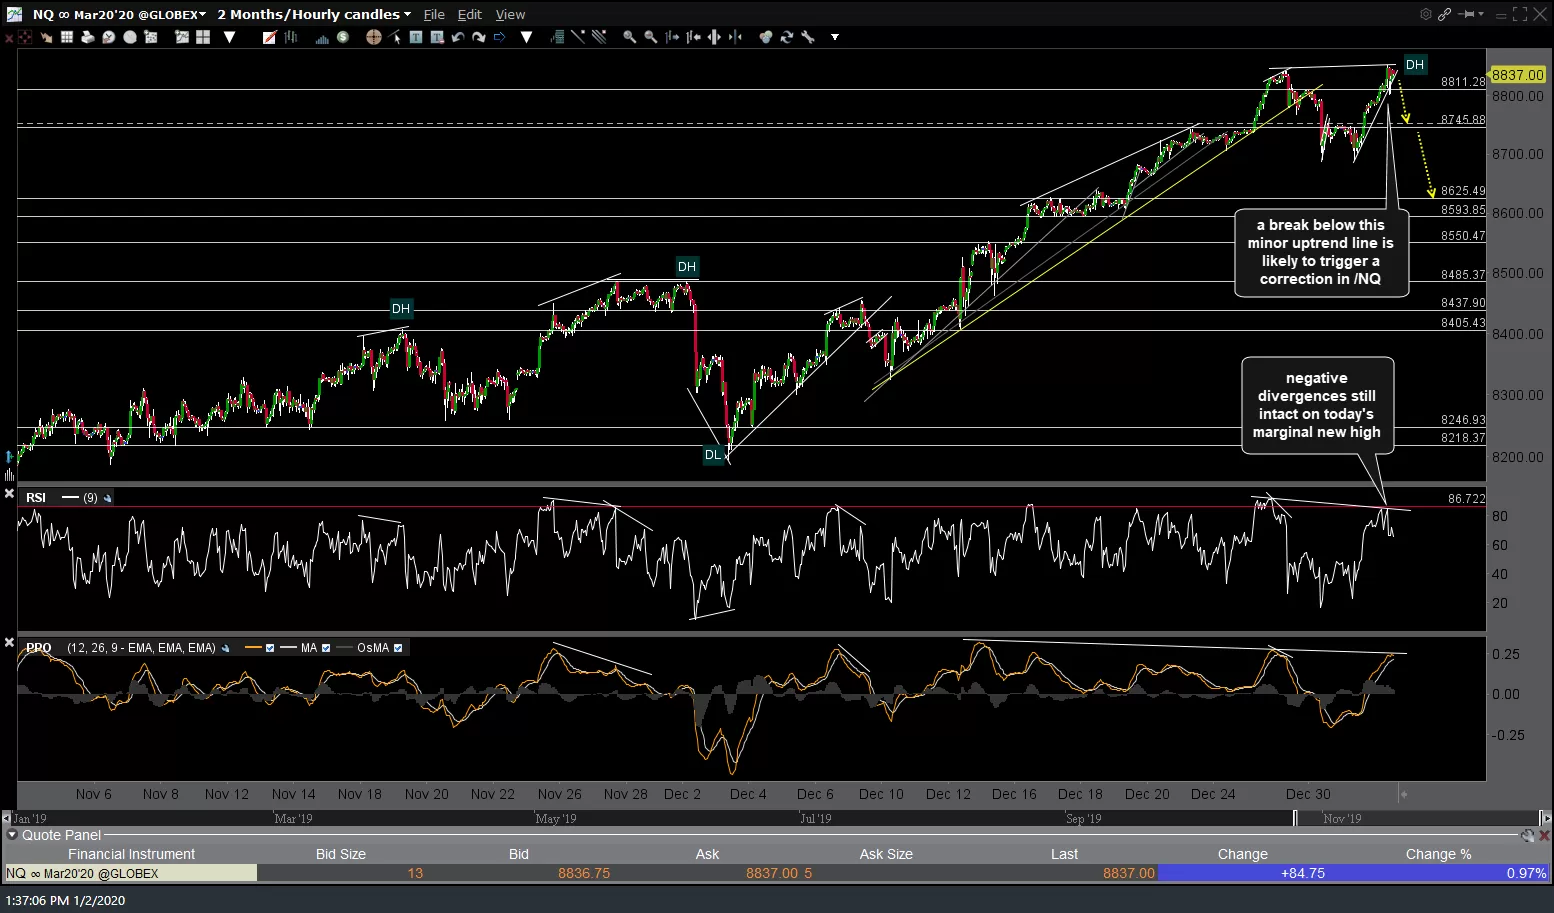
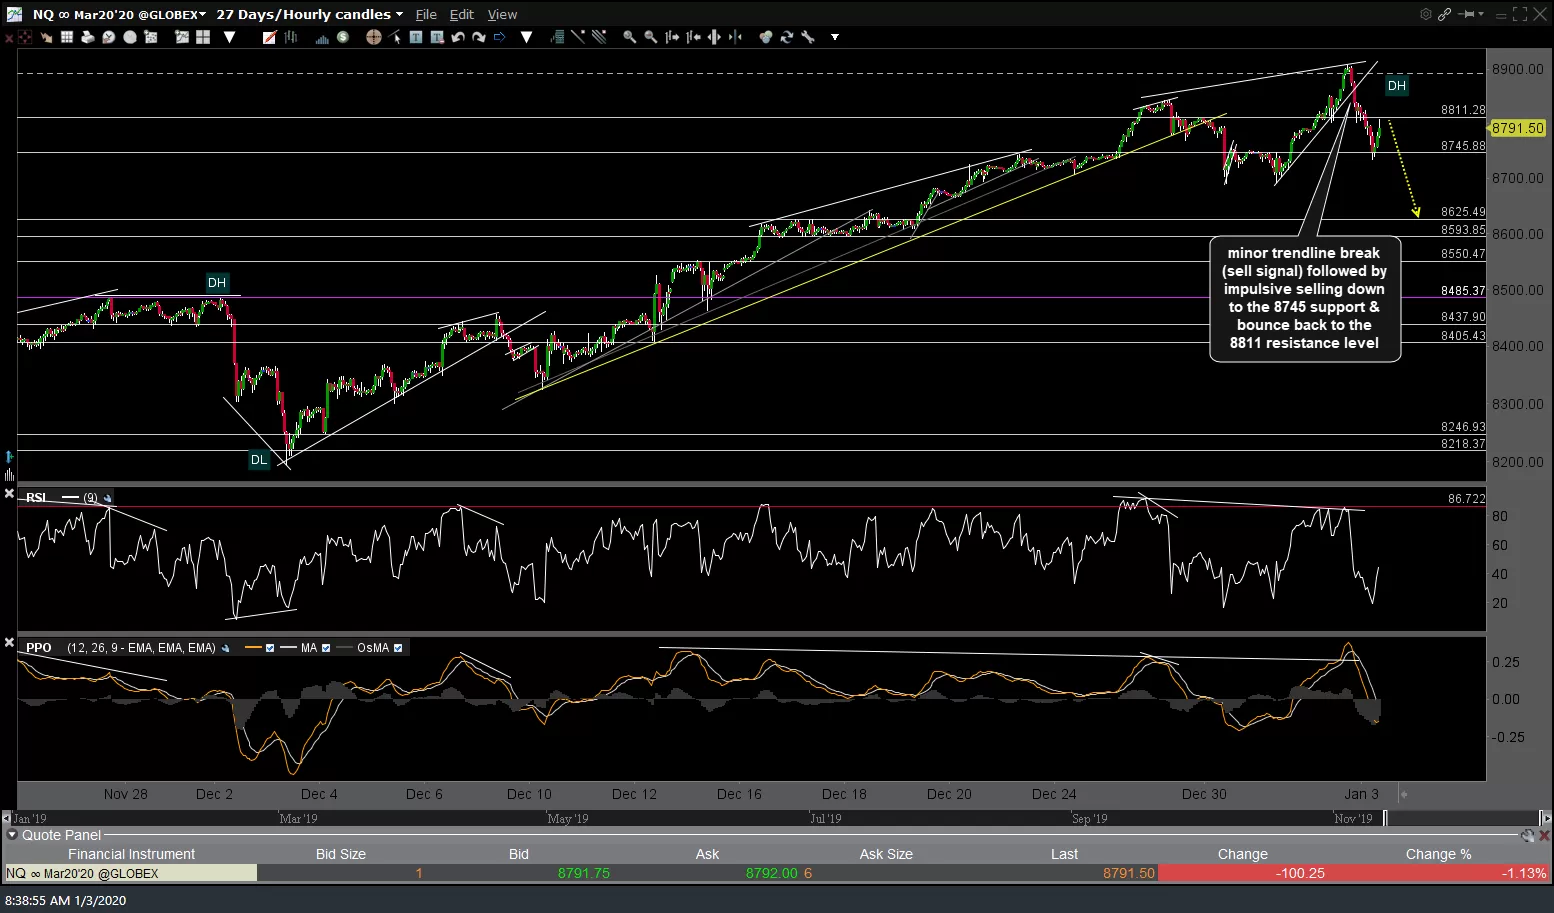
/NQ (Nasdaq 100) broke below that minor trendline highlighted yesterday, triggering a near-term sell signal followed by impulsive selling down to the 8745 support & bounce back to the 8811 resistance level which has so far contained the bounce. As with /RTY, I’d put slightly better odds on another leg down although we should have better visibility after the first 30-60 minutes of trading following the opening bell today. Previous & updated 60-minute charts.
-
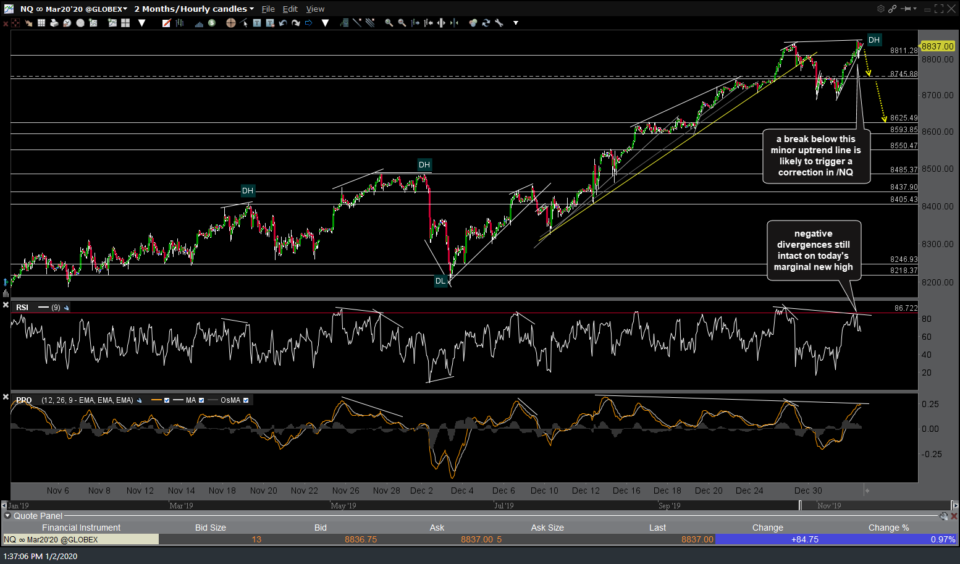
- NQ 60m Jan 2nd
-
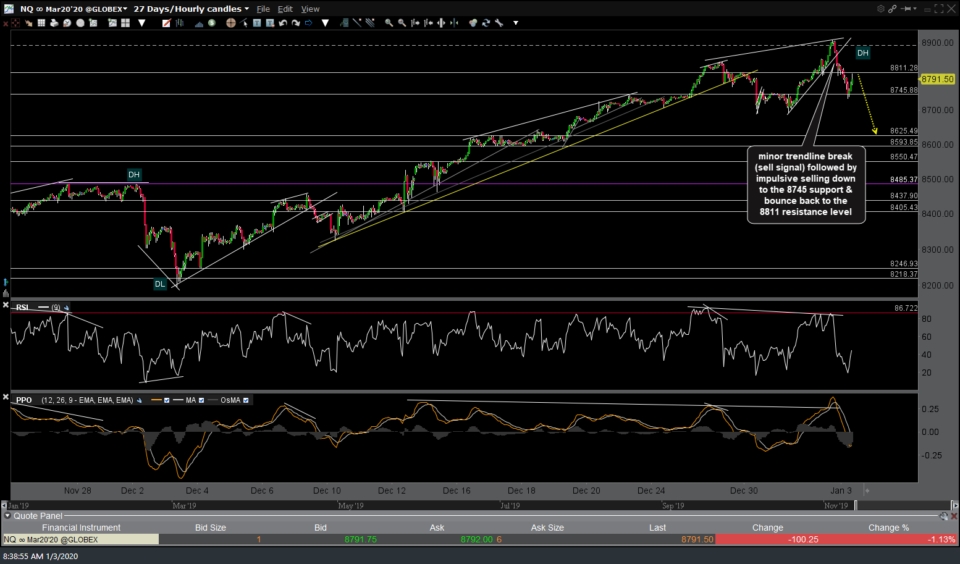
- NQ 60m Jan 3rd
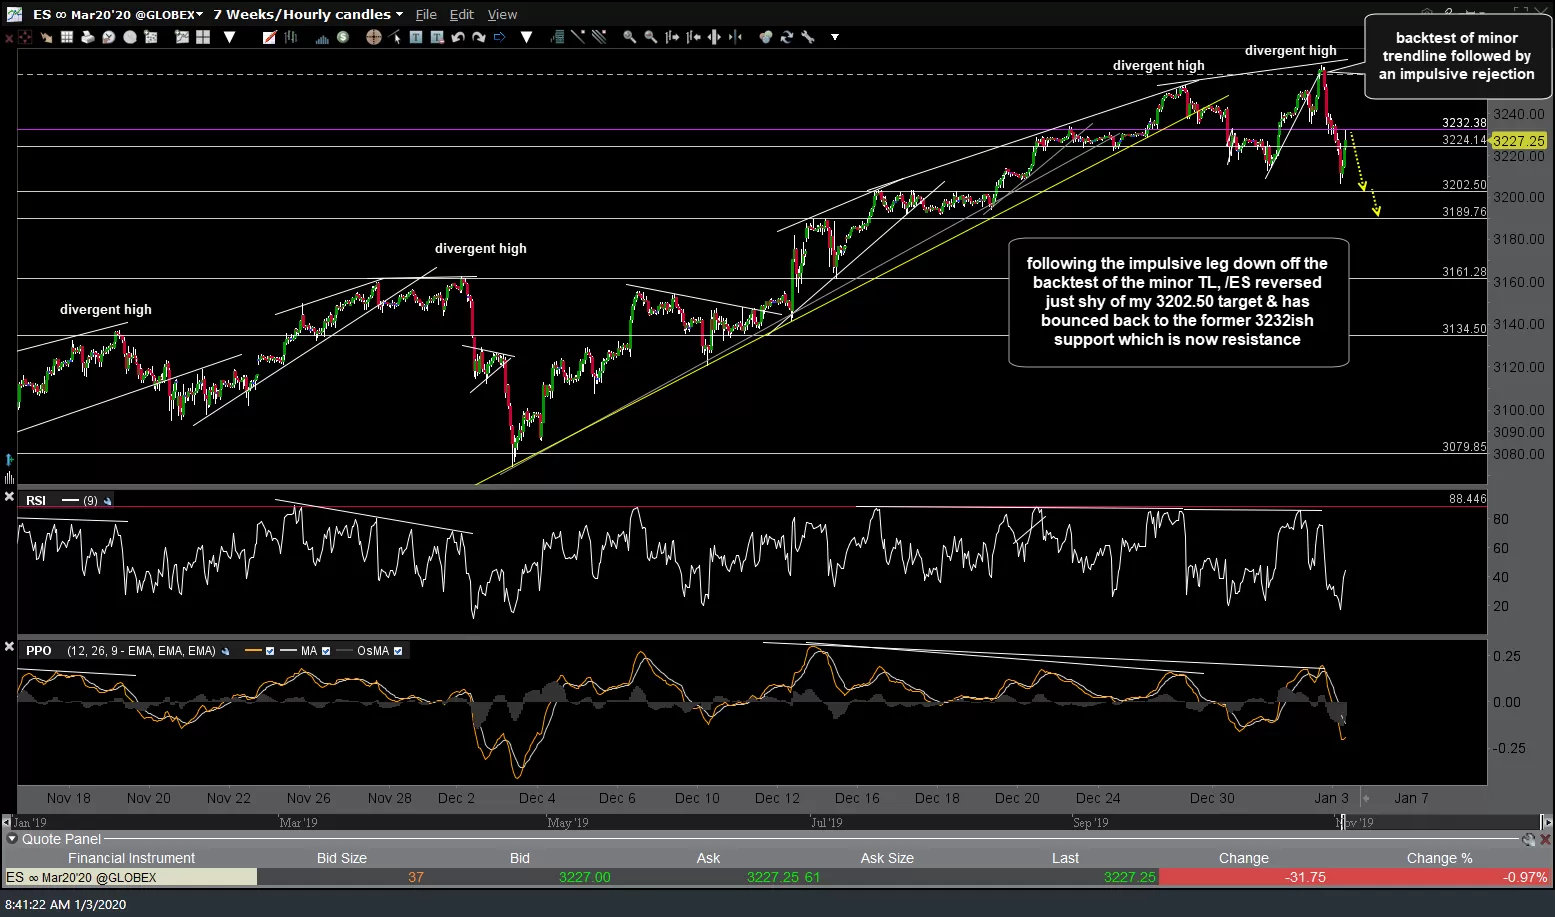
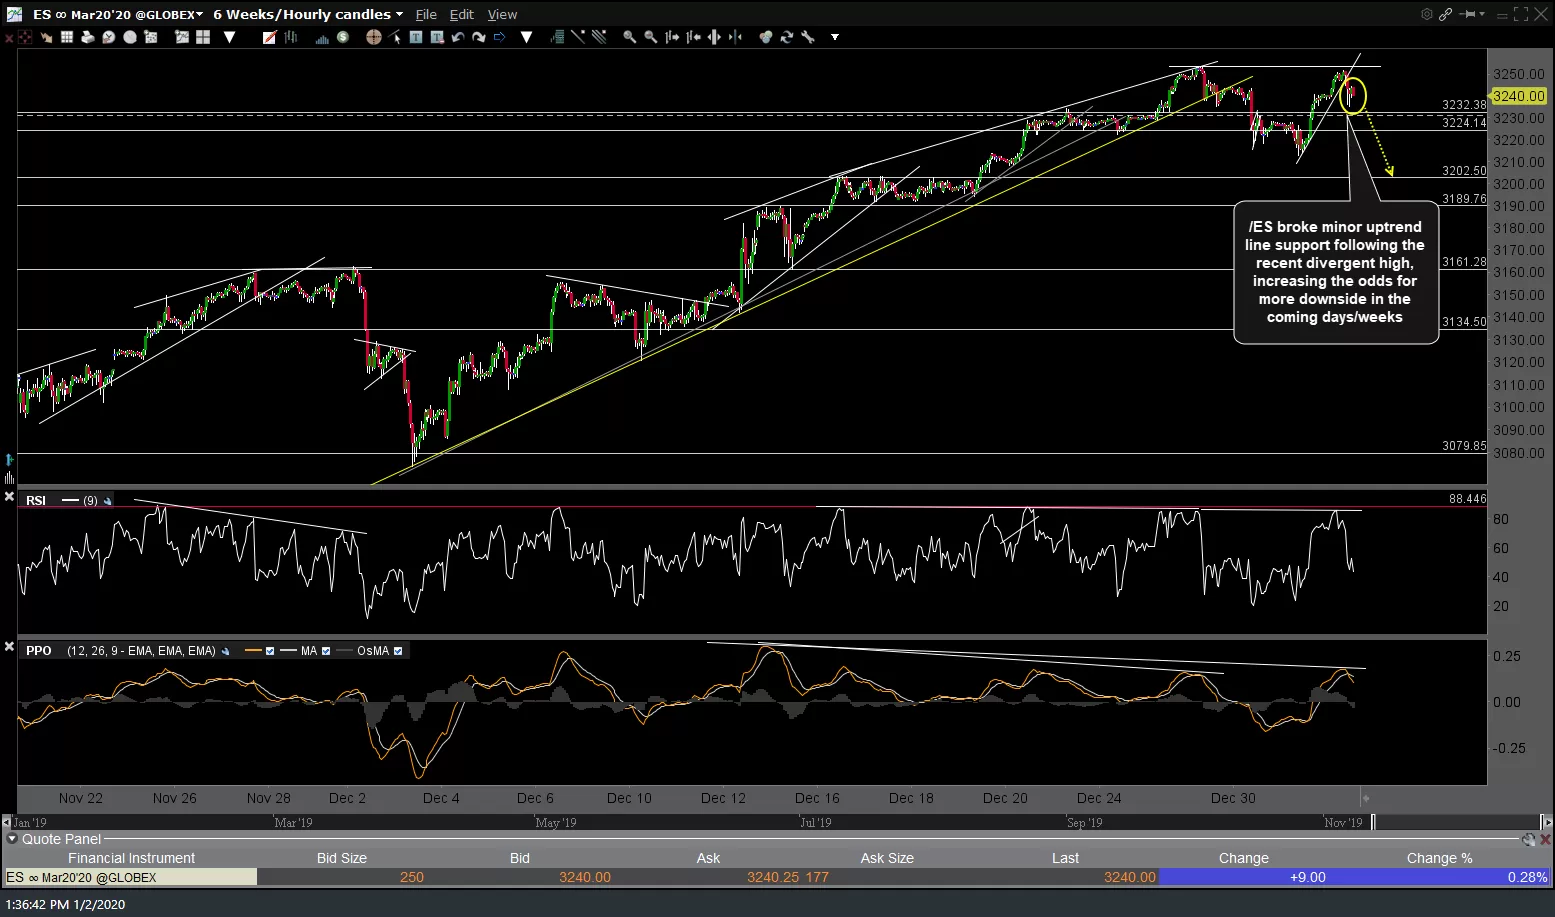
Following the impulsive leg down off the backtest of the minor TL, /ES reversed just shy of my 3202.50 price target & has bounced back to the former 3232ish support which is now resistance. Previous & updated 60-minute charts below.
-
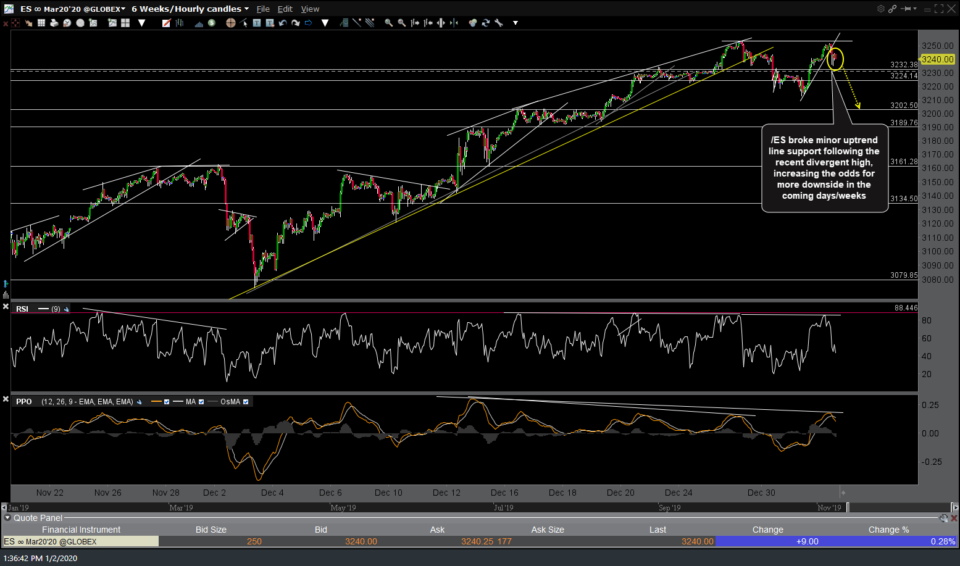
- ES 60m Jan 2nd
-

- ES 60m Jan 3rd